
Historical BTC Indicator With Perfect Track Record Signals Potential Price Surge
Market analysts have identified several technical indicators pointing toward a potential Bitcoin rally, though blockchain metrics reveal underlying market fragility that could postpone recovery.

Market analysts tracking Bitcoin (BTC) have identified several technical indicators suggesting an incoming "massive" rally. However, blockchain analytics reveal that BTC's path to recovery may face delays as investors adopt increasingly cautious positioning.
Key takeaways:
- Following a comparable bullish crossover confirmation, Bitcoin experienced a 600% surge throughout 2021.
- Blockchain metrics indicate ongoing selling pressure, implying that Bitcoin's price rebound could require additional time to materialize.
Bullish technical crossover suggests upcoming rally phase
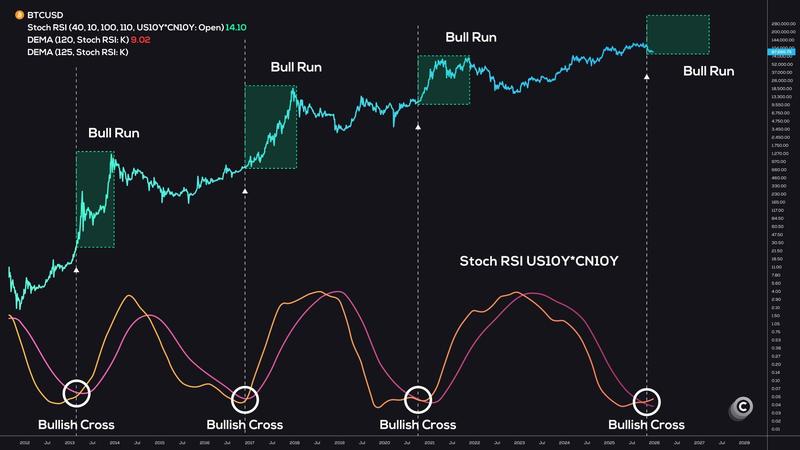
Market analyst Coinvo Trading identified the emergence of a positive crossover pattern featuring the Stochastic RSI indicators for both the United States 10-Year Treasury Yield (US10Y) and China 10-Year Government Bond Yield (CN10Y) when plotted against Bitcoin's weekly timeframe.
According to Coinvo Trading's recent post on X, this represents "Bitcoin's most accurate bull run signal" and has materialized only four previous times throughout history, each instance preceding substantial price surges.
The previous occurrence of a Stoch RSI crossover between the US10Y and CN10Y took place in October 2020, marking the beginning of a 600% BTC appreciation that culminated in its 2021 peak of $69,000.
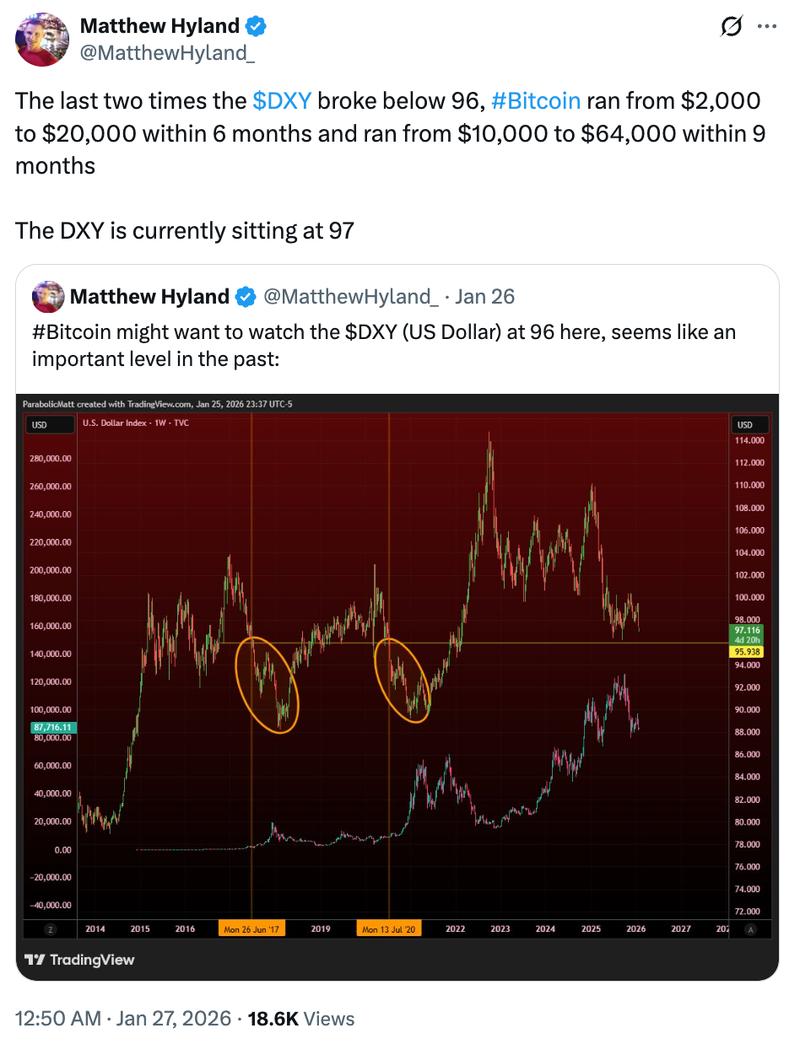
Analyst Matthew Hyland similarly projects a potential Bitcoin price breakthrough, drawing from the behavior of the US dollar strength index (DXY).
Hyland projects the BTC/USD trading pair will experience upward momentum when the DXY falls beneath 96, mirroring patterns observed during 2017 and 2022.
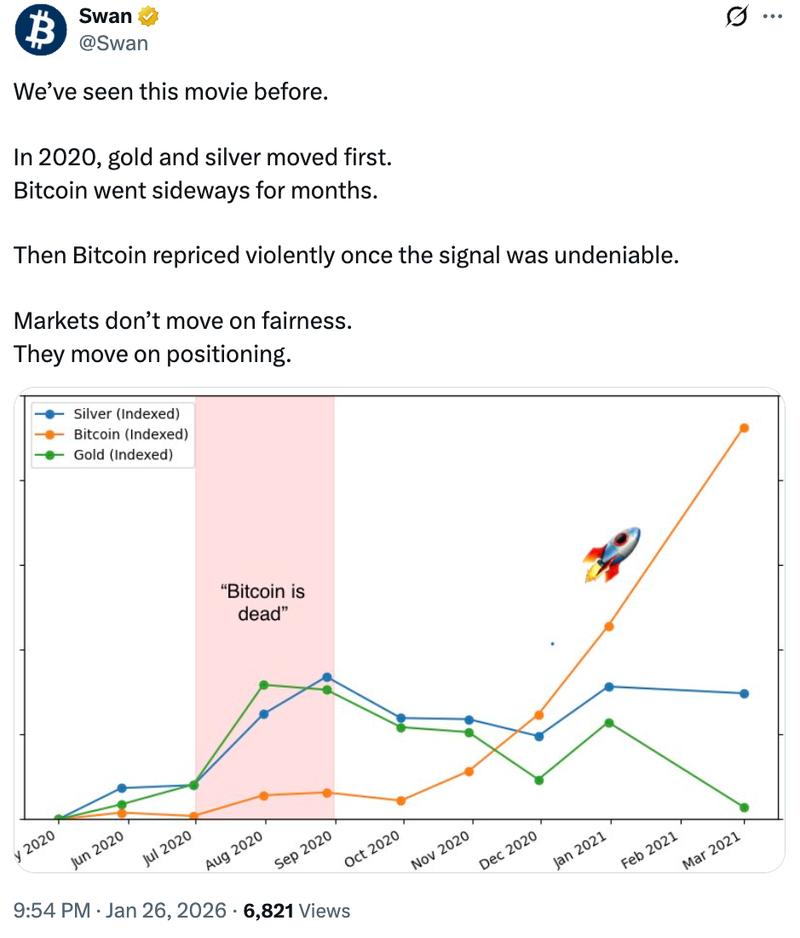
In parallel developments, gold reached an unprecedented peak exceeding $5,000, whereas Bitcoin continues trading within a range as the performance gap between these two assets expands.
According to Swan analysts, investors shouldn't find this divergence concerning, given that gold typically leads price movements while Bitcoin consolidates sideways across multiple months before experiencing a "violent" upward breakout.
Market conditions display "fragile" characteristics
Bitcoin's capacity to mount a durable recovery beyond critical price thresholds may face constraints stemming from a shortage of purchasing activity.
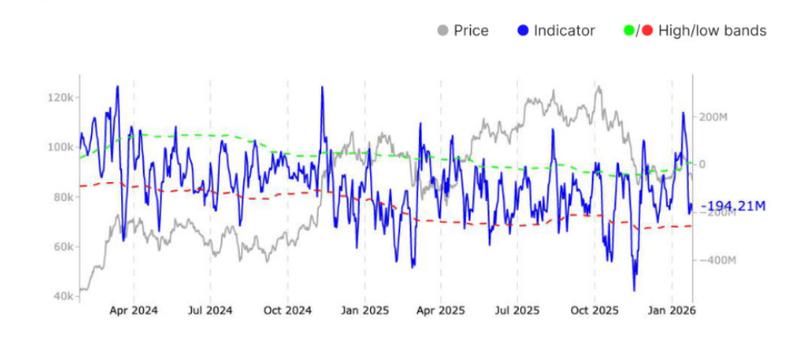
The spot cumulative volume delta (CVD) metric for Bitcoin, which tracks the net differential between buying and selling trade volumes, has experienced a pronounced negative reversal, validating a distinct transition toward seller-dominated activity.
This indicator experienced a dramatic decline to -$194.2 million during the previous week from $54.2 million the preceding week, indicating that "trader behavior has turned meaningfully risk-off, and reflects fading confidence in near-term upside price continuation," according to Glassnode's most recent Weekly Market Impulse report.
Simultaneously, weekly net flows for spot Bitcoin ETF products reversed from a $1.6 billion accumulation to a $1.7 billion withdrawal, pointing to "cooling institutional demand and increasing near-term downside pressure," stated the blockchain analytics platform, which further noted:
"Overall, market conditions have shifted more defensive, while persistent sell-side pressure and rising hedging demand suggest the market remains fragile."
According to Cointelegraph's previous coverage, Bitcoin may face another extended consolidation phase, referencing formidable resistance overhead, distribution pressure from spot BTC ETF products and escalating macroeconomic uncertainty.