BTC Bulls Target Fresh $74K Push Following Favorable US PCE Data Release
Positive US inflation figures lifted Bitcoin back toward the $74,000 level, providing support to risk assets across the board, though analysts remain divided on future price direction.

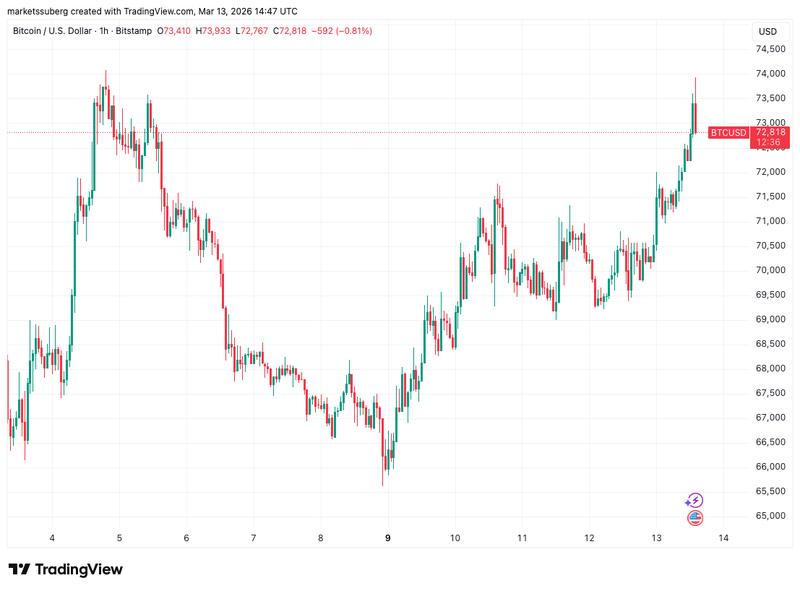
As Wall Street trading commenced on Thursday, Bitcoin (BTC) set its sights on price levels not seen in five weeks, supported by encouraging US inflation data that remained within expected parameters.
Key points:
- US inflation data keeps crypto and stocks higher as BTC price action tests $74,000 again.
- Bitcoin traders diverge over the future of the move, with a "bearish retest" risking a new price collapse.
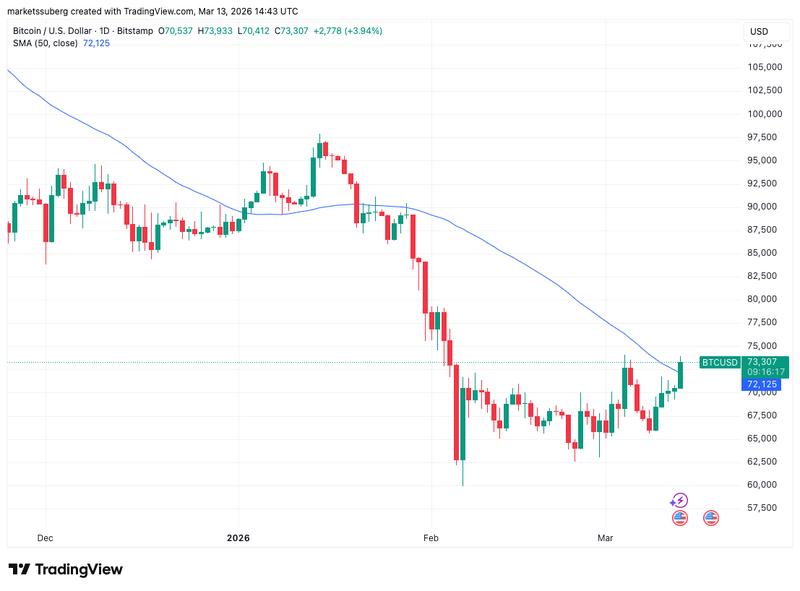
- BTC/USD finally recrosses its 50-day moving average trend line.
Favorable PCE Data Strengthens Bitcoin Rally
According to information from TradingView, Bitcoin price action established fresh local peaks approaching the $74,000 mark in the aftermath of the Personal Consumption Expenditures (PCE) Index release for January.
Recognized as the Federal Reserve's "preferred" measure for tracking inflation, the January PCE figures aligned with analyst predictions, registering at 0.3% on a month-over-month basis and 3.1% year-over-year, according to the Bureau of Economic Analysis.
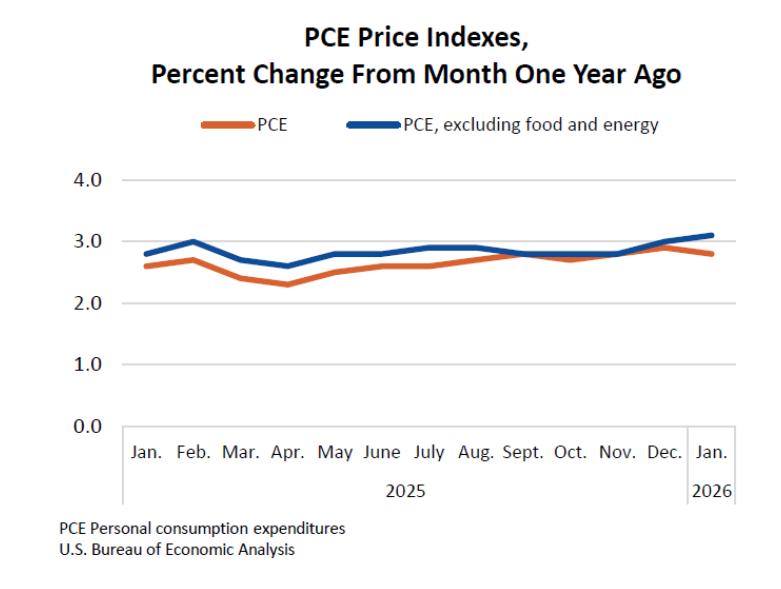
Despite representing the highest readings witnessed since the closing months of 2023, the data appeared to provide reassurance to risk-sensitive assets, with equity markets in the United States advancing approximately 0.5% at press time.
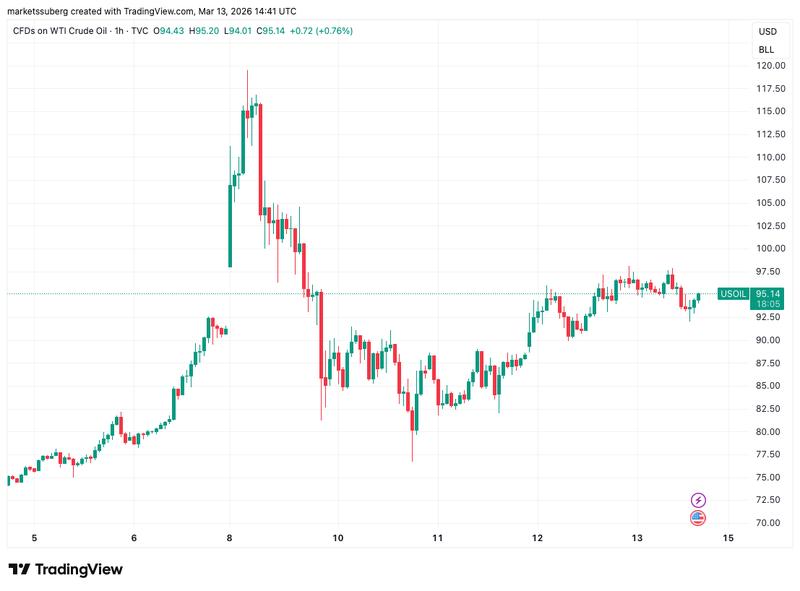
This development saw both traditional risk assets and cryptocurrency markets beginning to break away from a positive relationship with oil prices that had characterized trading throughout the week. WTI crude experienced a 2% decline on the day, trading in the vicinity of $95 per barrel.
Bitcoin Price Outlook: Rally to $79K or Reversal Risk?
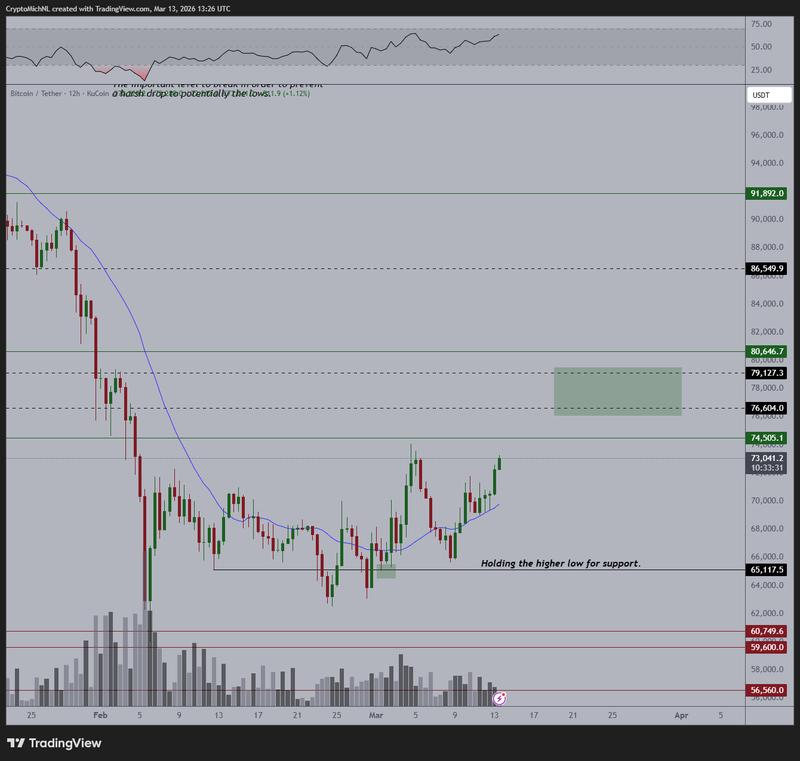
Offering his perspective on Bitcoin's trajectory, cryptocurrency analyst Michaël van de Poppe expressed measured optimism regarding what lies ahead.
"Resistance zone for me is between $76-79K for Bitcoin. I don't expect a fast breakout in one-go, but I would assume that we're going to see some extra momentum occur on the altcoin markets in that window," he wrote in a post on X.
"In the meantime; if Bitcoin gets there, it provides a monthly engulfing candle and therefore, it erases the entire correction of February."
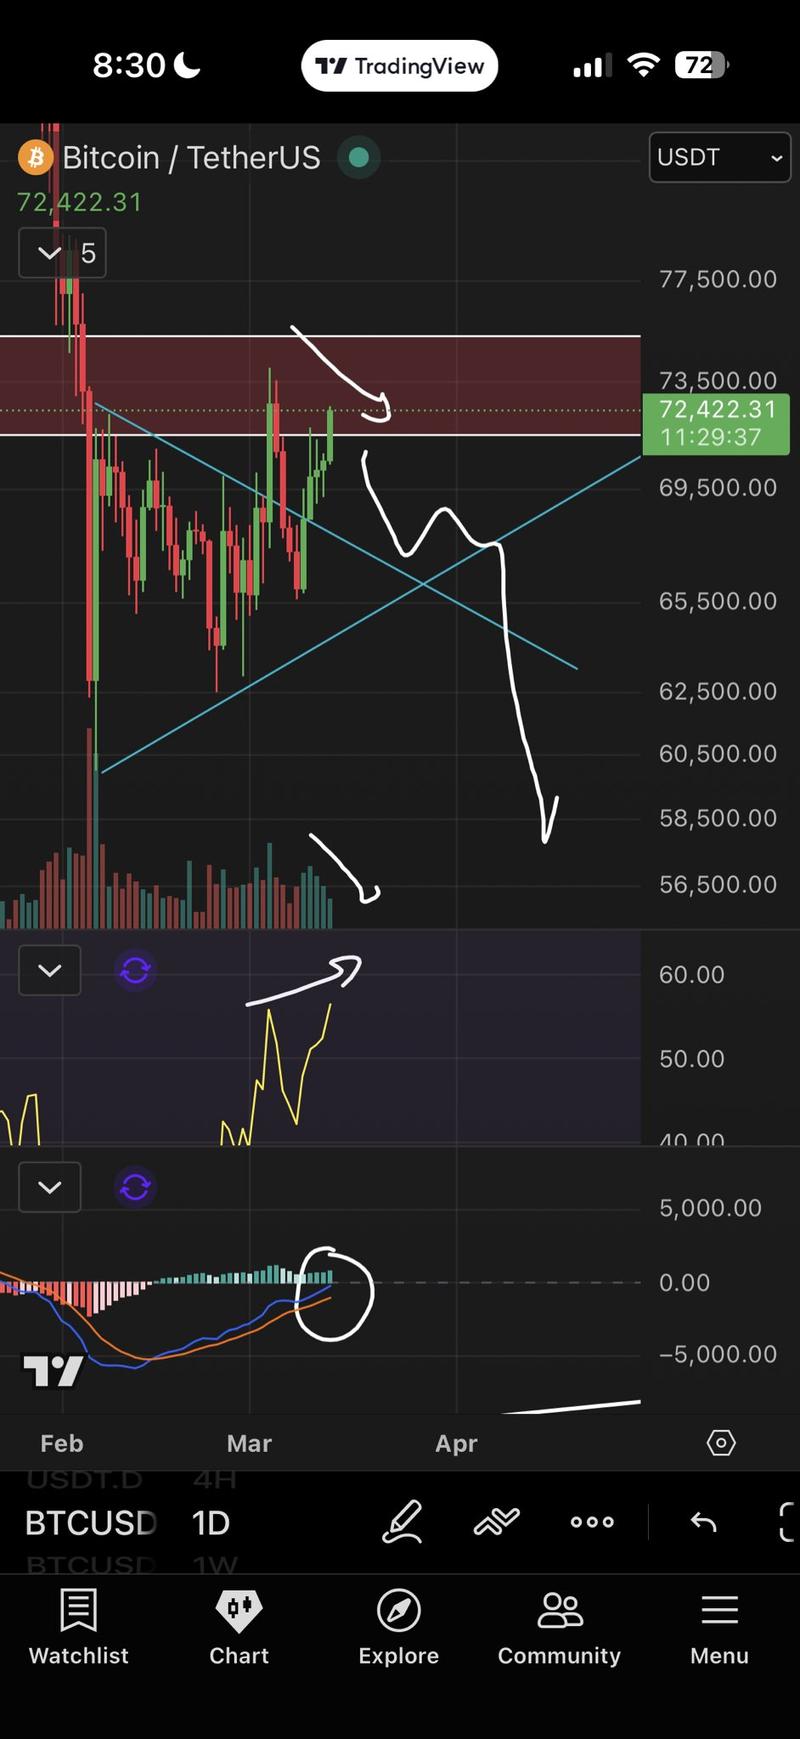
Alternative viewpoints maintained a more guarded stance, with analyst Daan Crypto Trades issuing caution about a "large drop" should the present trading range fail to hold.
Market observer Roman, who had already adopted a pessimistic position, characterized the current upward movement in BTC/USD as a "bearish retest."
"RSI bear divs, bear price action (volume down + price up), & complete reset of MACD," he summarized, referring to the relative strength index (RSI) and moving average convergence/divergence (MACD) price indicators on daily time frames.
Providing updated analysis through his Telegram channel during the trading session, independent market analyst Filbfilb directed attention toward open interest (OI) metrics.
Those monitoring the market, he explained, should be watching for OI to "ditch" — a development that would signal the conclusion of the current upward momentum.
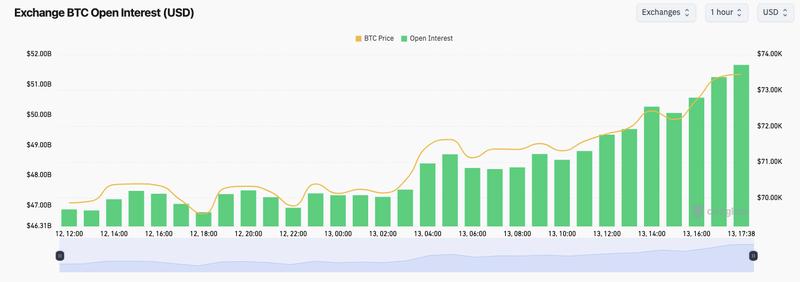
"No sign yet," he acknowledged, noting that price was now interacting with its 50-day simple moving average (SMA).
As Cointelegraph reported, this was a key overhead resistance zone of interest during previous breakout attempts.