Deeply Negative Coinbase Premium Signals Potential BTC Decline to $66K
As Bitcoin fell beneath $87,000, the Coinbase Premium reached its lowest point in a year, indicating diminished demand from US investors while technical analysis suggests a potential drop to $66,000.

The leading cryptocurrency Bitcoin (BTC) continued its downward trajectory during Sunday's trading session characterized by low liquidity, with the digital asset falling to $86,000—a price level not witnessed in five weeks. Technical indicators suggest the cryptocurrency might revisit its macro support level of $66,000 in the upcoming weeks, a critical price point established back in November 2024.
Key takeaways:
- On Sunday, Bitcoin's price descended below the $87,000 threshold as downward momentum intensified.
- The Coinbase Premium reached its lowest level in twelve months, indicating substantial selling pressure from US-based Bitcoin spot markets.
- Technical analysis shows Bitcoin's bearish formation points toward a $66,800 price objective.
US markets demonstrate intensified Bitcoin selling pressure
The Bitcoin Coinbase Premium Index, a metric that measures the price differential between BTC quoted on Coinbase versus Binance, turned negative during mid-December 2025, plummeting to a level as low as -0.17. The index hasn't registered such depressed readings since December 2024.
Despite brief price recoveries, BTC consistently trades at a discount on Coinbase when compared to other prominent cryptocurrency exchanges. For over five consecutive weeks, the index has maintained its negative position (see the chart below).
"The Coinbase Premium is experiencing a sharp decline and widening, suggesting significantly heightened BTC selling pressure on Coinbase relative to competing exchanges," stated derivatives analytics provider CoinGlass in a Monday X platform post.
According to CryptoQuant analyst TeddyVision in a recent QuickTake analysis, the Coinbase Premium Index remains "decisively below zero, demonstrating ongoing sell pressure originating from U.S. spot market flows."
Throughout history, an extended period of negative Coinbase Premium readings has correlated with "capital outflows from US-based exchanges, coupled with minimal evidence of aggressive dip-buying activity by long-term holders," noted the analyst, further stating:
"Until the premium stabilizes and turns positive, the upside remains fragile."
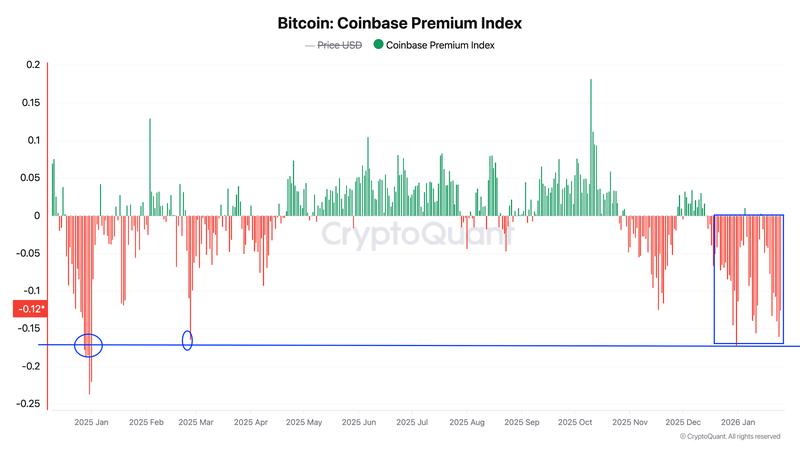
During the period when the index remained predominantly in negative territory from Dec. 18, 2024 through Jan. 5, 2025, Bitcoin's price experienced an 18% decline throughout that identical timeframe.
In a comparable pattern, the index maintained negative values from February 2025 through April 2025, resulting in a substantial 32% BTC price decrease to $74,500 by April 7, 2025, down from its prior all-time peak of $109,000.
Should US spot market demand continue its deterioration, market observers may witness a comparable price drawdown in BTC throughout the forthcoming weeks or months.
Furthermore, institutional appetite has experienced a sharp contraction, with US-based spot Bitcoin ETFs documenting approximately $1.72 billion in net outflows across the previous five trading days.
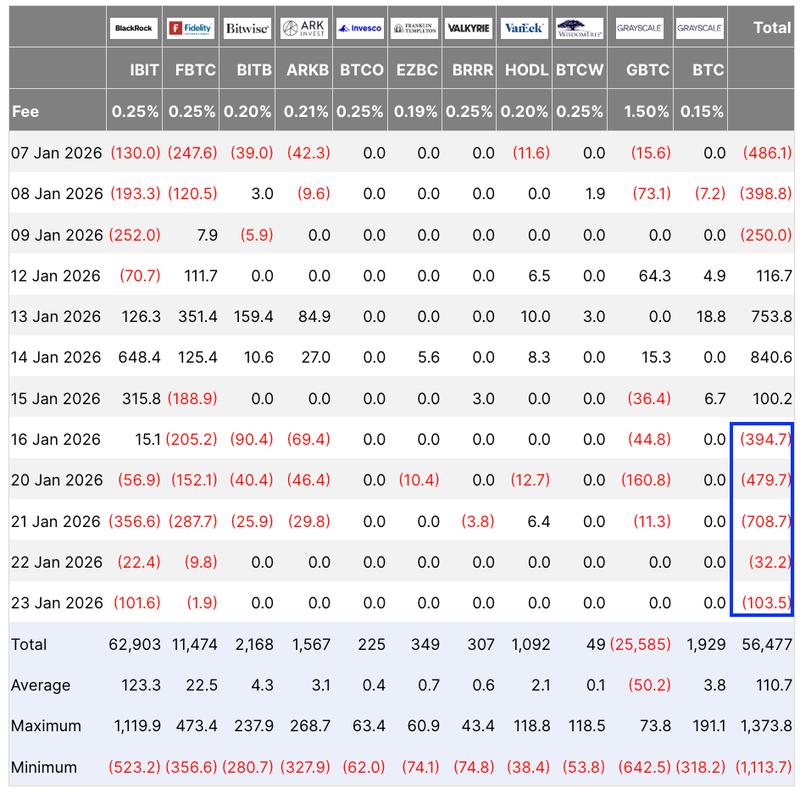
When combined with more than $1.7 billion in outflows from cryptocurrency investment products during the previous week, this data indicates persistent bearish sentiment pervading the entire market.
What is Bitcoin's potential price floor?
Experienced trader Peter Brandt identified a "sell signal" following the BTC/USD pair's confirmation of a bearish chart formation.
"Yet another sell signal in Bitcoin as a bear channel has been completed," Brandt communicated in a Monday X platform post.
The chart analysis from Brandt suggests additional downside vulnerability unless the price successfully recaptures the $93,000 level as a support foundation.
"The price needs to reclaim $93K to negate."
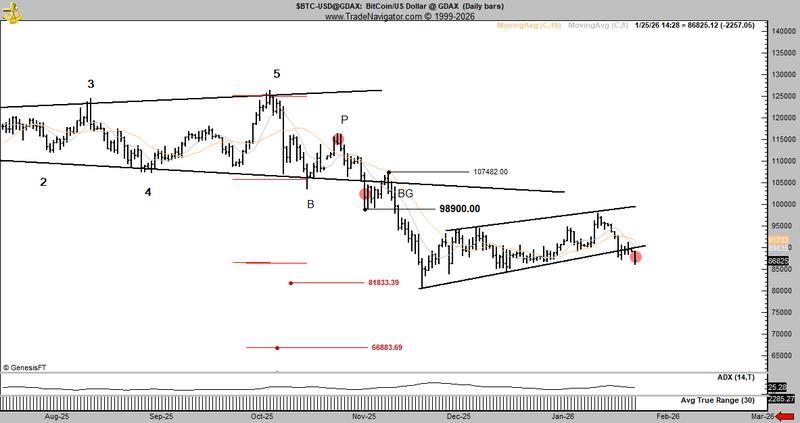
The measured price objective of this pattern, determined by adding the magnitude of the initial decline to the breakout level at $90,000, targets $66,800, which would constitute a 22% reduction from current pricing. This price target also corresponds closely with historical BTC price peaks from 2021 and 2024.
According to previous Cointelegraph reporting, the price range spanning $80,000 to $84,000 represents a critical support territory for Bitcoin, and maintaining this zone is essential to preventing additional downside movement.