Bitcoin Plummets to $83K: What Triggered the Two-Month Low?
BTC experienced a sharp 6% decline, marking its lowest price point in two months, coinciding with precious metals' dramatic pullback from record-high valuations.
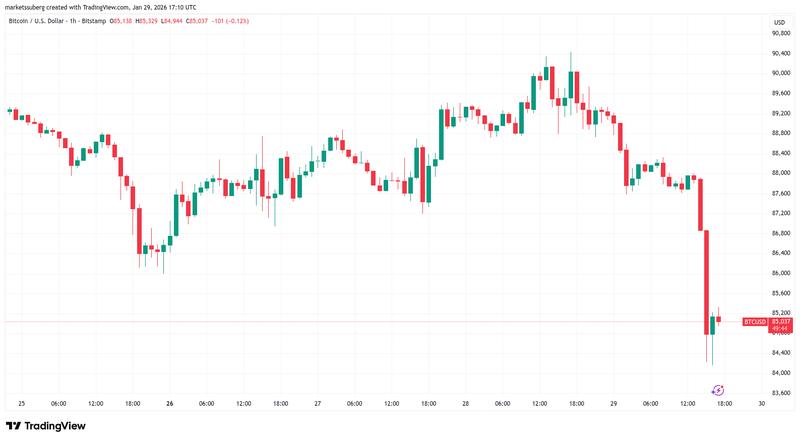
On Thursday, Bitcoin (BTC) plunged to its lowest levels in two months as cryptocurrency markets mirrored a rapid sell-off across equities and precious metals sectors.
Key points:
- BTC crashes beneath the $85,000 threshold amid widespread tumbling of macro assets from their all-time peaks.
- Precious metals including gold and silver deliver unexpected shocks to market observers as concerns mount regarding worldwide financial system stability.
- Monthly closing dynamics present significant challenges for BTC bulls attempting to steer clear of descending into "Bearadise" territory.
Bitcoin swept up in gold's dramatic downturn
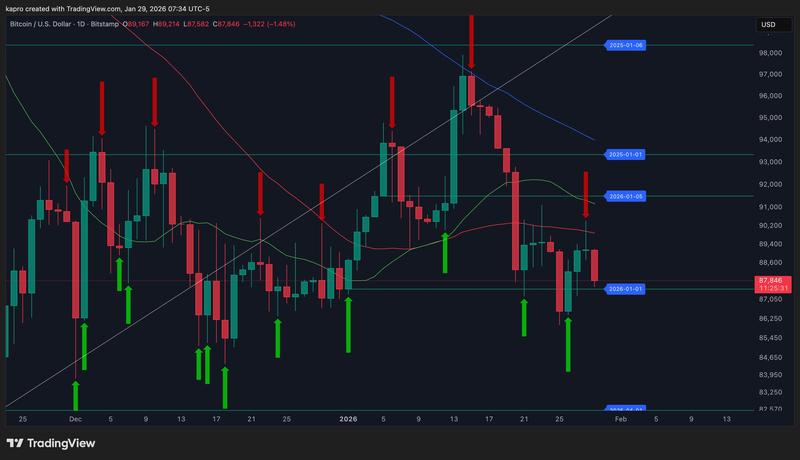
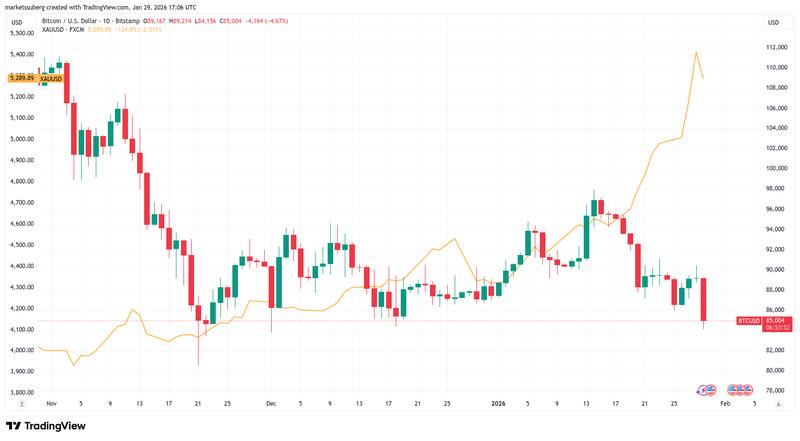
According to data sourced from TradingView, Bitcoin established fresh 2026 lows, bottoming out at $83,156 on the Bitstamp exchange, representing nearly 6% in losses throughout the trading day.
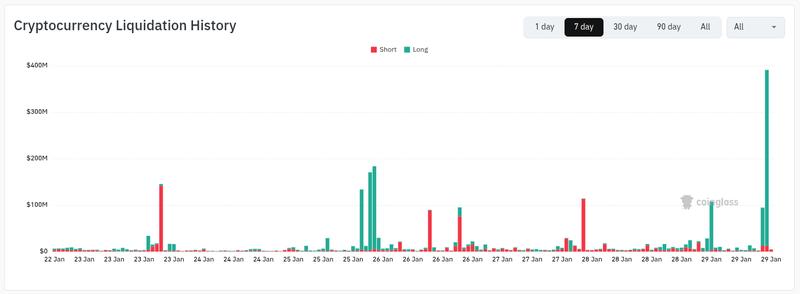
Critical support levels at the 2026 yearly opening price, alongside adjacent moving average indicators, proved insufficient to contain selling pressure as cryptocurrency liquidations surpassed the $500 million mark within a four-hour window.
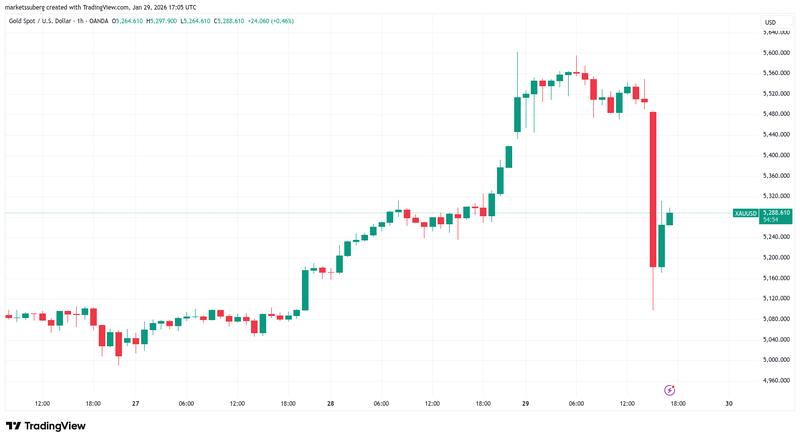
The decline in Bitcoin and alternative cryptocurrencies didn't occur in isolation, as they responded to broader global asset uncertainty that blindsided market participants. Gold, having reached an unprecedented $5,600 milestone earlier in the same trading session, experienced a staggering $400 collapse within a mere 30-minute timeframe.
Through this dramatic movement, the yellow metal wiped out more monetary value than the complete market capitalization of Bitcoin itself.
In response to these developments, Bitcoin market observers weighed the macro-level instability against optimism that a market correction could ultimately provide bullish traders with an opportunity for recovery.
"Wild markets today as Gold and Silver erase trillions in minutes. Yes, $BTC goes down during that panic flush, and we'll probably see some lower levels," crypto trader, analyst and entrepreneur Michaël van de Poppe wrote in a post on X.
"Time for Bitcoin to shine is coming."
Meanwhile, Nic Puckrin, CEO of crypto education resource Coin Bureau, joined the chorus of voices cautioning that the volatile swings witnessed in precious metals markets were anything but typical.
"Gold and silver just don't do this," he told X followers, calling the latest price action "insane."
According to Puckrin's assessment, the US dollar, serving as the globe's reserve currency, was experiencing "confidence erosion," and the surging worldwide demand for gold and silver represented clear evidence of investors and central banking institutions preparing for potential market disruption.
"They are prepositioning," he concluded.
"Get excited about metals, but realise these buys are essentially insurance. And, when gold and silver actually 'do this,' we need to pay attention."
Monthly candle close becomes focal point for BTC price
In earlier coverage, Cointelegraph reported on suspicious activity within Bitcoin exchange order-books involving an unidentified whale entity engaged in price "suppressing" tactics.
Keith Alan, cofounder of trading resource Material Indicators, which reported the phenomenon, later reiterated the need to reclaim the 2026 open by the monthly candle close.
"$BTC is once again testing support at what I consider to be the most important level on the chart. The Monthly candle close rapidly coming into focus makes this an inflection point for the trend," he wrote on X.
"A monthly close above the Yearly Open will fuel hopium for bulls. A close below that Timescape Level ($87.5k) will puts us on a path to Bearadise."