Major Bitcoin Volatility Imminent as Bollinger Bands Signal 'Powerful' Price Movement
Technical analysis combined with onchain metrics are strengthening predictions that Bitcoin's price could reach as high as $84,000 in the near future.

Bitcoin (BTC) appears poised for additional upward volatility as multiple technical analysis tools and onchain metrics indicate the BTC price is positioned for a "powerful" breakout to the upside.
Key takeaways:
- Bitcoin's Bollinger Bands indicator hints at major volatility ahead.
- BTC's symmetrical triangle breakout targets $84,500.
- Heavy BTC accumulation by investors around $83,900-$85,200 could stop bulls.
Bitcoin Bollinger Bands point at "strong" breakout
The Bollinger Bands indicator, which traders utilize to evaluate price momentum and volatility levels within specific ranges, has contracted to its most narrow point on record when viewing the monthly timeframe, suggesting significant volatility is approaching.
Analyst Cantonese Cat highlighted in a Tuesday X post that this represents the "tightest Bollinger Band squeeze on the monthly Bitcoin chart, ever," further stating:
"This will lead to a very powerful move when it expands."
Between December 2023 and August 2025, the BTC/USD trading pair experienced an approximate 235% surge to reach its present all-time high of $126,000, following a break above the Bollinger Bands' upper boundary. A comparable event occurred in 2016, which sparked the 2017 bull market rally where BTC price climbed over 4,000%.
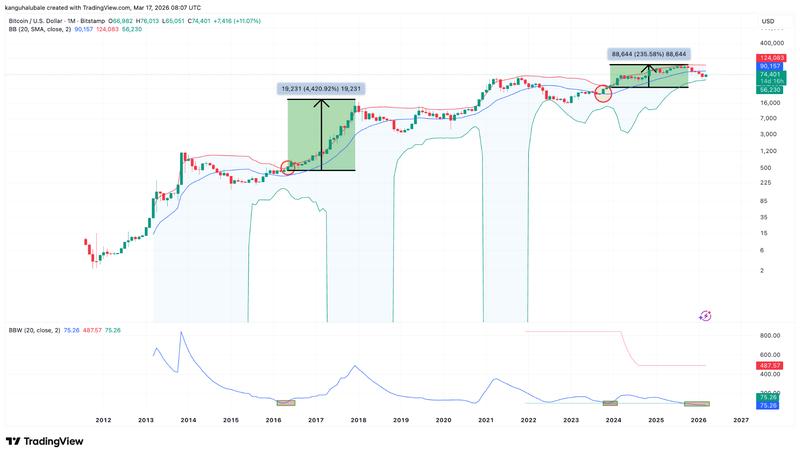
Osemka, another market analyst, commented that these types of "squeezes produce strong moves."
In the meantime, Bitcoin has successfully recaptured critical support levels, specifically the 200-week exponential moving average (EMA) positioned at $68,000, along with the 50-day simple moving average (SMA) located at $70,900 during its most recent advance to six-week peaks above $74,400.
This movement simultaneously drove the price beyond the upper trendline of a symmetrical triangle formation at $68,500.
Symmetrical triangles develop when an asset creates lower highs alongside higher lows, consolidating into an increasingly tight range. Resolution occurs once the price penetrates either trendline and advances by a distance equivalent to the pattern's maximum height.
Based on this technical formation, the bullish price target stands at $84,500, representing a 14% increase from the current price level.
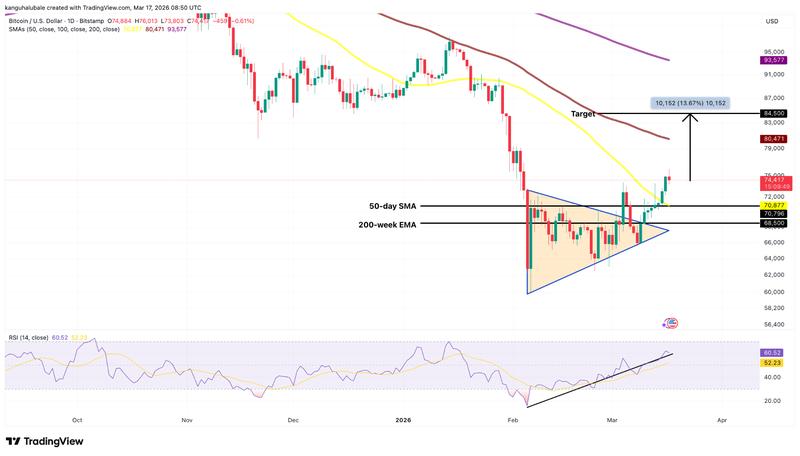
The relative strength index, or RSI, currently sits in positive territory at 60, signaling that buying pressure is gaining control. The next obstacle for Bitcoin is the 100-day SMA positioned near $80,500.
According to Cointelegraph's previous reporting, a closing price above this threshold would validate the breakout more strongly, implying the downtrend could be concluding.
Onchain data caps Bitcoin's upside at $84,000
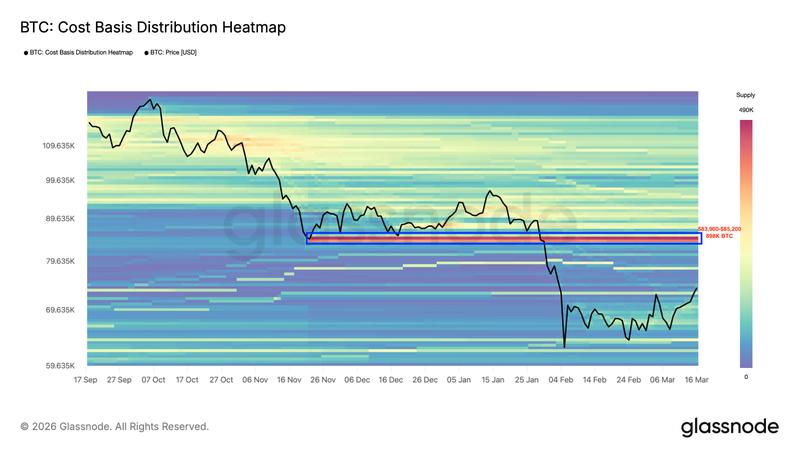
The cost basis distribution heatmap from Glassnode reveals substantial accumulation within the $83,000-$85,000 range, where market participants acquired over 898,000 BTC.
These cost-basis clusters highlight price zones where major investors built their positions, frequently functioning as magnets during rallies as participants defend their entry points or increase their exposure.
According to Michael Nadeau, analyst and founder at The DeFi Report, in a Tuesday X post, this indicates "4.4% of the BTC supply was scooped up at those levels between November of last year and early February this year."
This zone constitutes a significant source of selling pressure, expected to limit recovery efforts in the vicinity of the $84,000 level.
Nadeau noted that "That level also corresponds to the Short Term Holder cost basis," further explaining:
"It's likely that the current countertrend rally will hit resistance at those levels."
It's worth noting that between $74,200 and the $83,000 cost-basis cluster, there exists relatively minimal historical supply concentration, suggesting that a breakthrough above the present range could enable the price to advance more readily toward the larger overhead resistance zone.
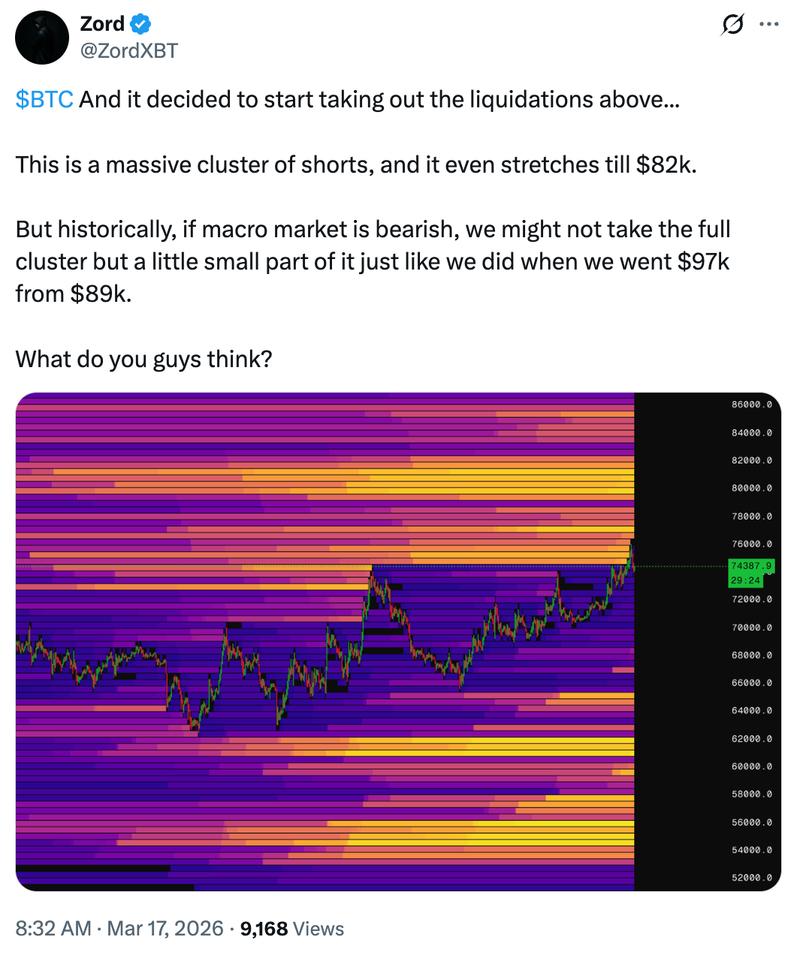
Data from order-book liquidity also indicates $82,000 as a significant level, where a "massive cluster of shorts" is located, according to analyst Zord.
According to previous Cointelegraph coverage, certain analysts maintain that Bitcoin's long-term price downtrend remains active, contending that the most recent relief rally represents typical BTC price bear market behavior.