BTC Momentum Pauses Near $76K: Critical Price Zones as Federal Reserve Decision Looms
With Bitcoin hovering around $74,000, market participants prepare for potential price volatility following Jerome Powell's Federal Reserve statement that may trigger movement to crucial BTC support and resistance zones.

On Wednesday, Bitcoin (BTC) changed hands at $74,000, representing a 2.6% decline from the six-week peak of $76,000 that was achieved on Tuesday, while market participants anticipate turbulence following the United States monetary policy announcement regarding potential interest rate reductions.
Key takeaways:
- The odds of the US Federal Reserve leaving interest rates unchanged today are 100%.
- BTC price may drop as low as $60,000 if support between $72,000 and $65,000 breaks.
Markets fully price in unchanged rates scenario
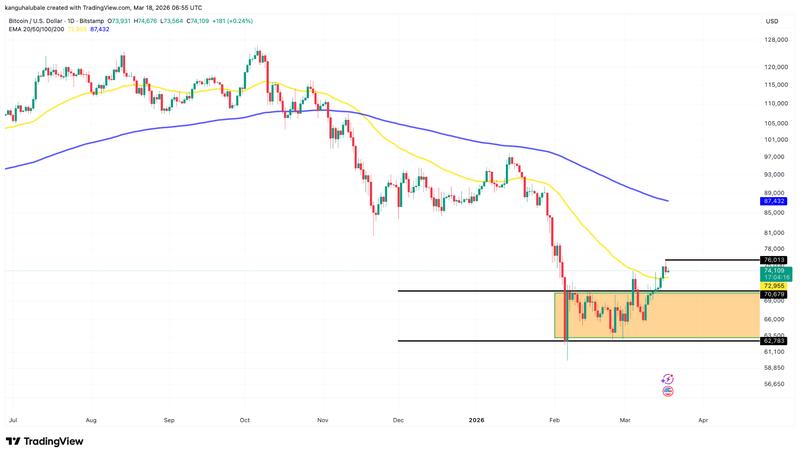
TradingView data reveals that following a range breakout on Friday, the BTC/USD trading pair established consecutive daily candle peaks, though it failed to penetrate the $76,000 resistance threshold.
As the Federal Open Market Committee (FOMC) conducts its scheduled meeting on March 17-18, financial markets may experience turbulent price movements toward critical BTC price thresholds throughout the coming days. The announcement regarding interest rate policy is scheduled for Wednesday at 2:00 PM ET.
According to Polymarket participants, there exists a 100% probability that existing interest rates will stay within the 3.5% to 3.75% range, with under 1% likelihood assigned to a 0.25% reduction.
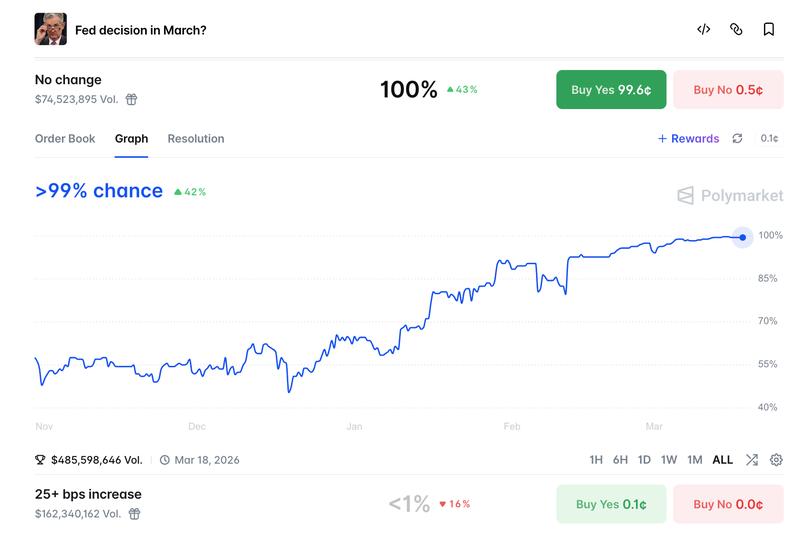
Participants in the futures market have similarly priced in a 98.9% probability that the Federal Reserve will maintain current interest rates, assigning zero possibility to a 25 bps cut.
Nevertheless, market observers suggest that potential downside movement stemming from unchanged interest rates has already been incorporated into current valuations.
At the same time, traders must navigate additional volatility drivers, such as the ongoing conflict between the US and Israel-Iran, concerns surrounding US inflation metrics and surging oil prices, alongside Federal Reserve Chair Jerome Powell's remarks following the FOMC gathering.
US President Donald Trump has once more applied pressure on Powell regarding interest rate cuts, stating on Truth Social on Thursday that the Fed chair needs to lower borrowing costs without delay.
As a result, market observers will pay close attention to Powell's rhetoric during the FOMC press conference to detect any modification in his messaging.
"The rate decision is fully priced in so low surprise risk," veteran trader Matthew Dixon said in an X post on Wednesday.
According to Dixon, the "real volatility catalyst is Powell's tone," specifically whether it leans hawkish or dovish.
"Jerome Powell is going to make things sound as good as he can on his last meeting. This is his legacy," crypto analyst Sykodelic said, adding:
"I think we see a big unwinding of hedges after the meeting and both equities and Bitcoin continue to juice."
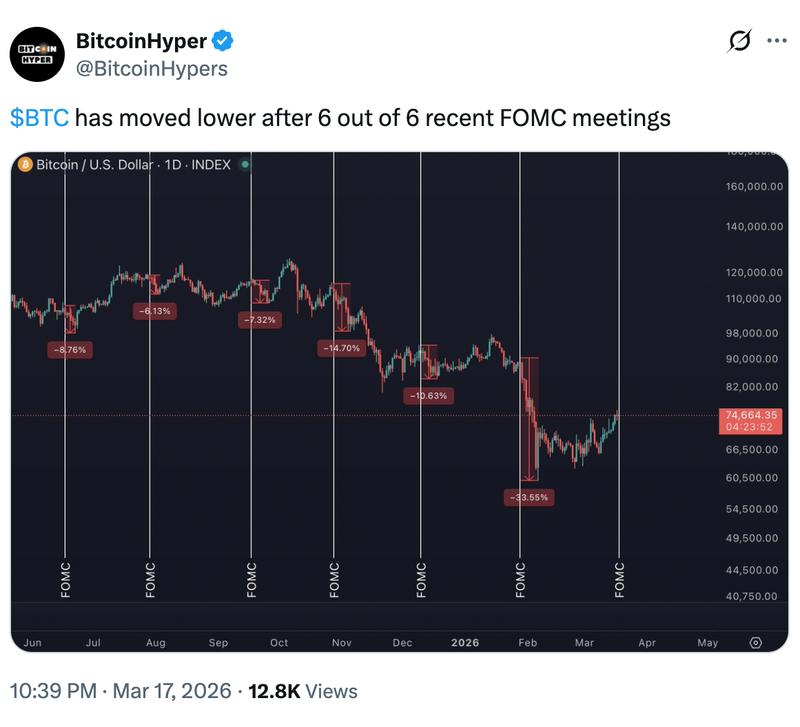
According to crypto trader BitcoinHyper, BTC price experienced downward movement following the previous six FOMC gatherings.
Critical support and resistance zones for BTC
To establish a path toward higher valuations exceeding $80,000, Bitcoin needs to convert the $76,000 resistance threshold into a support foundation.
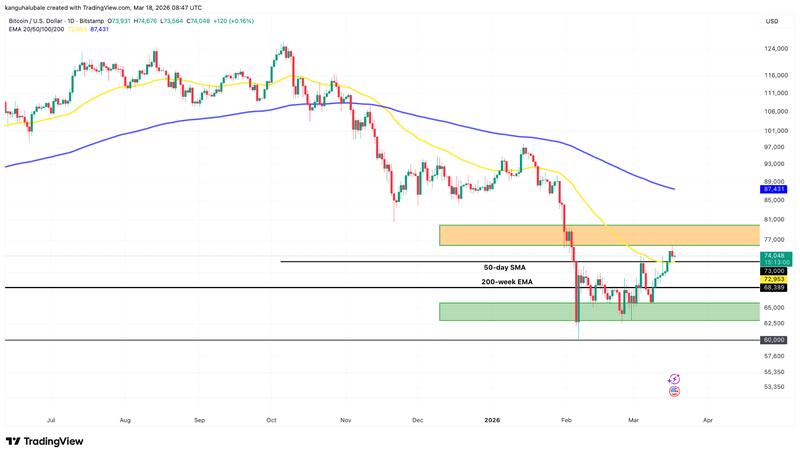
To achieve this outcome, BTC/USD needs to initially maintain its price action above the 50-day simple moving average (yellow line) displayed on the daily timeframe chart. On March 1, BTC price surpassed the 50-day SMA for the initial time since January 1.
Should bullish market participants succeed in driving the price beyond the $76,000-$80,000 resistance zone, the subsequent objective becomes the 200-day SMA positioned at $87,411.
Sustained appetite from spot Bitcoin ETFs represents one potential driver for upward price momentum. On March 17, Bitcoin ETFs recorded $199 million in inflows, representing the seventh straight day of positive netflows.
Conversely, bearish traders will work to maintain the $76,000 resistance barrier, elevating the probability of a retreat into the $72,000-$65,000 zone, where the 200-week exponential moving average (EMA) resides.
Beneath the $65,000 level, the subsequent critical zone of focus lies between $62,500 and $60,000, a move that would eliminate all appreciation recorded since Feb. 6.
According to Cointelegraph's previous reporting, a closing price beneath the moving averages would shift momentum back toward bearish participants, converting the recent week's upward movement into a bull trap scenario.
This article does not contain investment advice or recommendations. Every investment and trading move involves risk, and readers should conduct their own research when making a decision.