Why February Could Be Bitcoin's True Bull Season, Not October
Historical performance data reveals February as one of Bitcoin's strongest months, prompting network economist Timothy Peterson to call it the authentic "Uptober" phenomenon. Could this pattern emerge again in the coming month?
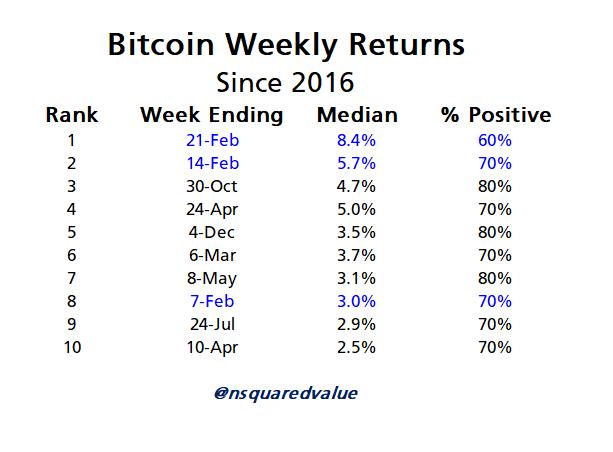
While Bitcoin's (BTC) gains have remained constrained to a mere 2.2% this month, the upcoming February period may signal a transition toward more bullish momentum. Historical data spanning back to 2016 reveals that the week concluding on Feb. 21 has consistently produced the strongest median return at 8.4%, with the leading cryptocurrency finishing in positive territory 60% of the time during this period.
Key takeaways:
- Historical data shows February has generated a median weekly BTC return of 7%, exceeding the seasonal momentum typically associated with October.
- Performance during the early weeks of February has consistently signaled bearish cycles, with years 2018, 2022, and 2025 all establishing their downward trajectory within the initial three-week period.
The seasonal advantage of February and how it influences BTC
Timothy Peterson, a Network Economist, emphasized that February has proven to be among Bitcoin's most reliably bullish periods throughout its history, frequently outpacing the commonly recognized "Uptober" phenomenon that occurs in the fourth quarter. Peterson's analysis suggests the underlying catalyst stems from macroeconomic factors rather than dynamics specific to the cryptocurrency sector.
The middle portion of February coincides with the publication of complete annual corporate earnings reports and forward-looking guidance statements, which generally carry optimistic projections. These positive outlooks commonly encourage investors to adopt a more risk-on stance, resulting in capital flows that include allocation toward Bitcoin. Peterson stated,
"The two-week period for Feb 7-21 features a median weekly return of => 7% per week!!"
Peterson additionally observed that the opening three weeks of February have proven particularly informative during years marked by corrections. In early 2018, Bitcoin posted a 4% gain, experienced a 3% decline in 2022, and dropped 5% in 2025—all years that ultimately concluded with negative annual performance.
While volatility remains elevated though showing signs of moderating, Peterson contended that Bitcoin may be favorably positioned for an upward reversal if macroeconomic stress metrics, including the CBOE's volatility index (VIX), experience cooling trends.
Bitcoin's potential ceiling for 2026 stays above the $200,000 threshold
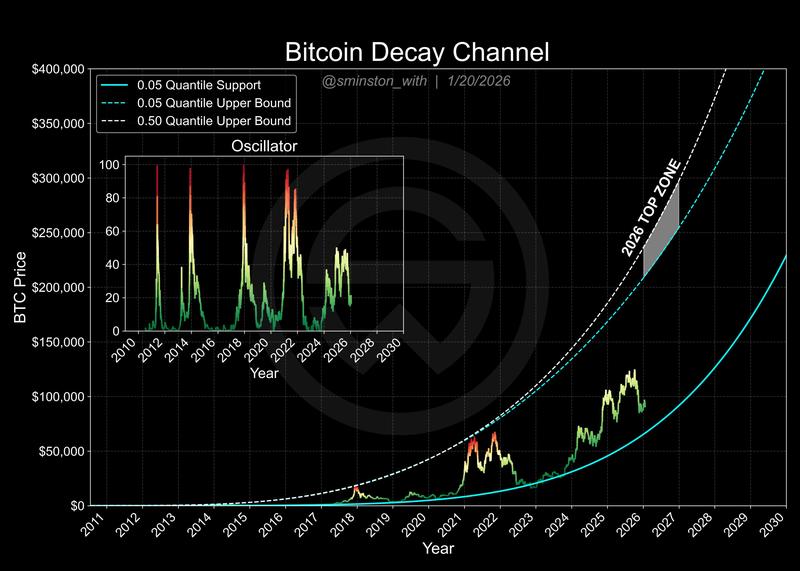
Researcher Sminston With continues to maintain an optimistic outlook regarding BTC's long-term cycle trajectory. Utilizing the Bitcoin Decay Channel analytical framework, With projected Bitcoin's peak price for 2026 to fall within a range of $210,000 to $300,000, acknowledging that although the model lacks precise timing capabilities, its price corridor boundaries have demonstrated historical accuracy.
This extended-timeframe perspective receives additional support from momentum indicators. Sina, the author behind the Bitcoin Intelligence Report, indicated that Bitcoin's momentum metrics have shifted into positive territory notwithstanding the recent pronounced correction phase.
Per Sina's assessment, the consolidation pattern that has persisted since the beginning of January maintained the overall flow architecture intact. The selloff occurred in parallel with the Nasdaq's downturn following revived tensions around US tariff policies, indicating a headline-driven movement rather than a fundamental breakdown specific to Bitcoin itself.
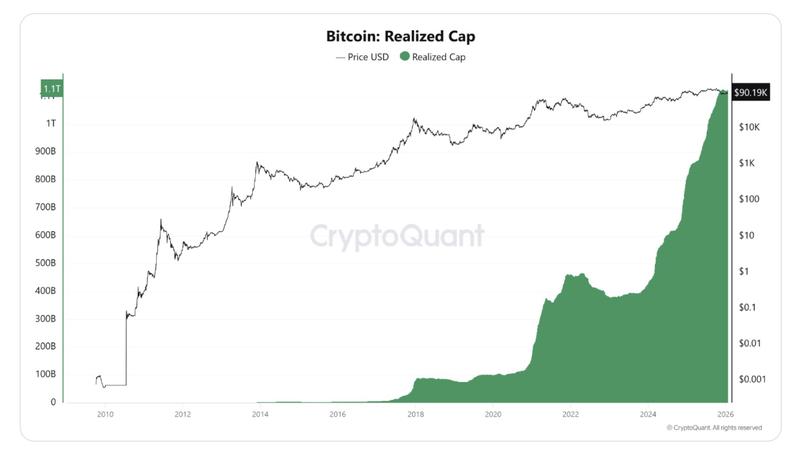
Corroborating this perspective, XWIN Research observed that Bitcoin continues to trade within a consolidation framework rather than exhibiting a definitive risk-off trajectory. Although heightened long-term bond yields are constraining valuation expansion potential, the Realized Cap metric continues its upward progression, serving as evidence that spot-market capital inflows are persistently entering the network infrastructure.