
Critical Bitcoin On-Chain Metric Could Signal Upcoming Surge in BTC Demand
While Bitcoin continues to struggle beneath the $65,000 threshold amid sporadic waves of heavy selling activity, a particular on-chain metric has reached stability, offering clues about the potential return of spot market buying interest.

On-chain analytics monitoring the profitability levels of Bitcoin (BTC) investors have declined back to the long-term historical average, suggesting a potential reset in asset valuation. Concurrently, cryptocurrency exchange order flow data reveals a reduction in intense selling activity, as the spot cumulative volume delta (CVD) has experienced a slight uptick despite spot trading volume falling from $7.6 billion to $6 billion.
These developments are influencing market participants' outlook regarding the timing of renewed robust spot demand for BTC and the likelihood of such activity triggering a trend reversal in price action.
Bitcoin's Valuation Indicator Returns to Historical Average
According to Glassnode analyst Chris Beamish, the Bitcoin market value to realized value (MVRV) ratio has returned to normal levels following the complete reset of previous +1 standard deviation extremes.
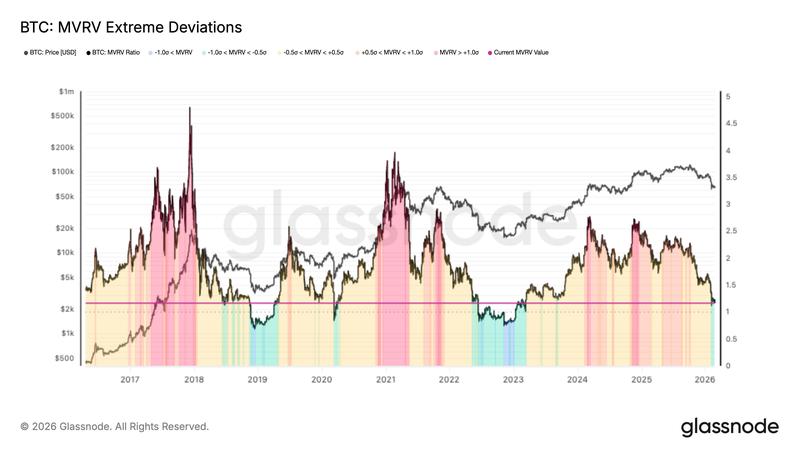
The MVRV ratio evaluates market capitalization against realized capitalization to assess overall investor profitability levels. When this metric compresses toward its long-term mean, valuations approach levels that have historically presented more favorable risk-reward scenarios, although BTC hasn't yet descended into deeply undervalued territory.
Similarly, the realized capitalization metric, which calculates the aggregate value of Bitcoin based on the last transaction price for each coin moved on-chain, has decreased to $1.09 trillion from its November 2025 high of $1.12 trillion, representing approximately $33 billion in network value contraction.
The 30-day change registers at -2.26%, indicating ongoing capital outflows from the network. BTC researcher Axel Adler Jr. notes that coins aged between three and six months currently represent 25.9% of total supply, constituting the largest cohort. A significant portion of these holdings were established near cycle peaks and are currently in unrealized loss territory.
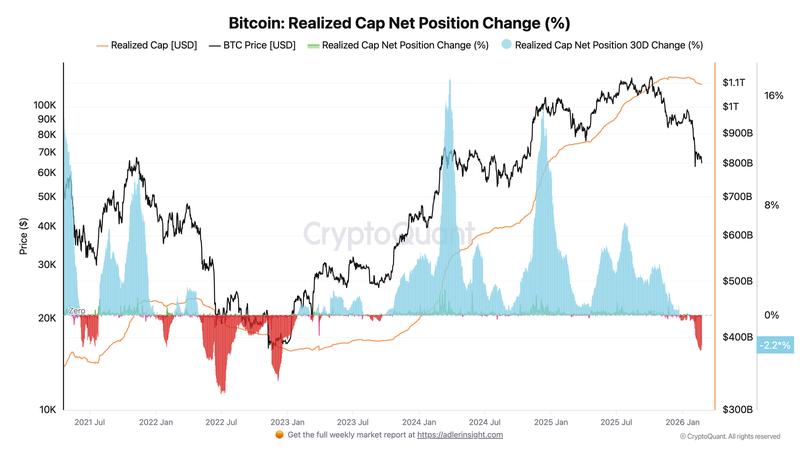
Collectively, these indicators characterize a defensive market phase. BTC holders are not experiencing large-scale capitulation events, while fresh capital inflows have yet to reverse the downward trajectory in realized cap. Adler Jr. characterized the current trend as "neutrally defensive" pending the cap's return to positive momentum.
Bitcoin's Volume Delta Indicates Careful Absorption Pattern
Exchange flow metrics corroborate this assessment. Data from Glassnode reveals the spot cumulative volume delta has improved, moving to -$161.5 million from -$177.1 million, indicating a moderate decrease in aggressive selling behavior.
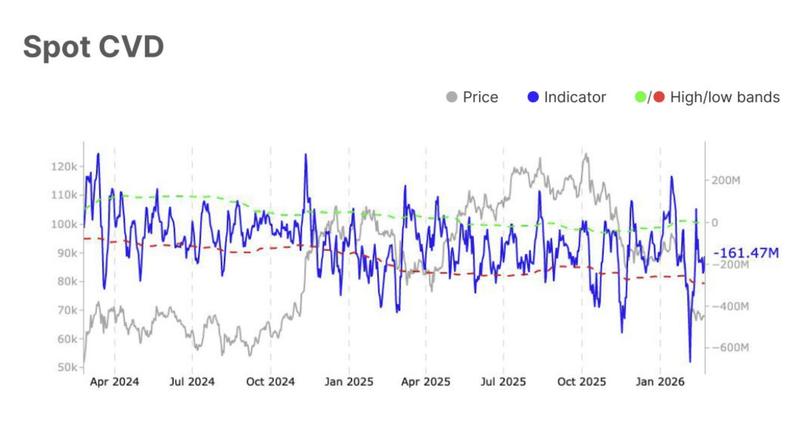
The CVD metric tracks the cumulative differential between buy-side and sell-side market orders. Spot trading volume has contracted to $6.0 billion from $7.6 billion, suggesting reduced market participation and more volatile price movements.
Historical cycle analysis shows that pronounced CVD drawdowns during price declines have frequently coincided with local bottom formation once selling pressure starts to stabilize. BTC price consolidation within the $62,000–$64,000 range, combined with a flattening CVD trajectory, could indicate that available supply is being absorbed with greater efficiency, especially if spot market participation begins to rebound from current depressed levels.