
Altcoin Market Witnesses $209B Capital Exodus in 13 Months: Is Bitcoin the Destination?
Alternative cryptocurrencies experienced net outflows exceeding $209 billion, dwarfing the selling pressure observed during Bitcoin's five-month correction. Are these funds flowing into Bitcoin?

Alternative cryptocurrencies, with the exception of Ether (ETH), have witnessed net selling volume totaling $209 billion beginning in January 2025, representing one of the most significant drops in speculative interest for digital assets during this market cycle.
Trading volumes for altcoins on Binance experienced an approximately 50% decline from November 2025 onwards, indicating a consistent reduction in market participation. This downturn has occurred simultaneously with Bitcoin's volume share on the platform experiencing growth.
Market analysts have indicated that the reduction in altcoin interest, combined with heightened stablecoin dominance levels, suggests the wider cryptocurrency market is reallocating capital into BTC throughout the ongoing bearish trend.
Growing spot volume disparity between altcoins and Bitcoin
Cryptocurrency market analyst IT Tech observed that the aggregate difference between buying and selling activity for alternative coins, not including BTC and Ether (ETH), has reached negative $209 billion. This measurement evaluates net spot market demand across centralized trading platforms for altcoin pairs. When the reading shows positive values, it reflects increasing spot demand, which was momentarily visible during January 2025.
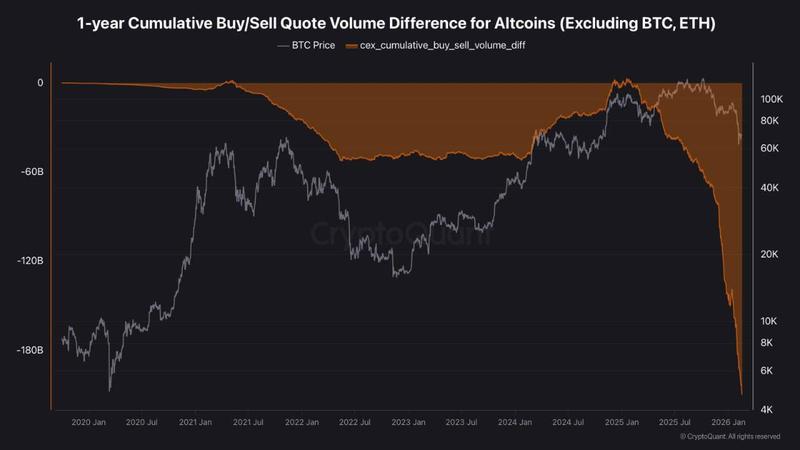
When the cumulative delta reaches such negative territory, it demonstrates the lack of sustained spot purchasing activity. The analyst highlighted that this measurement tracks net flow disparities instead of price valuations, meaning it cannot pinpoint market bottoms. Throughout the preceding 13 months, funds have flowed out of altcoin markets with minimal offsetting inflows.
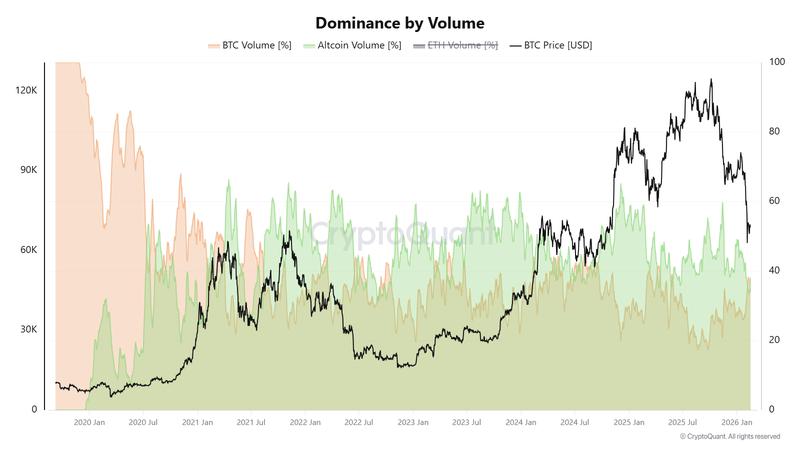
Trading volume statistics from Binance support this directional shift. When BTC approached the $60,000 price point during early February, overall trading activity underwent redistribution. Bitcoin volumes climbed to 36.8% of aggregate activity on Feb. 7. By mid-February, altcoin volumes had fallen to 33.6%, declining from their November peak of 59.2%.
Crypto analyst Darkfost noted that comparable rotation patterns emerged in April 2025, August 2024, and October 2022. Throughout these corrective market phases, capital aggregated into Bitcoin while altcoin trading volumes experienced contraction.
Tether's market dominance climbs to unprecedented levels
The market capitalization dominance of Tether's USDt (USDT) hit the 8% threshold on the weekly timeframe chart, matching previous peak levels that persisted from June 2022 through October 2023. Increasing stablecoin dominance generally corresponds with capital flowing into dollar-backed assets instead of being allocated to tokens such as BTC (BTC) and Ether (ETH).
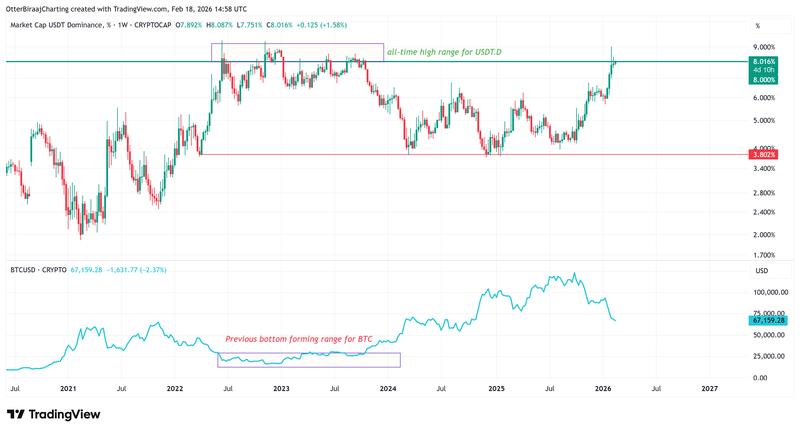
Historical data reveals that heightened USDT dominance levels coincided with Bitcoin trading near bear market bottoms, particularly during 2022 and 2023. Declining dominance has frequently served as among the first indicators of an emerging bullish market trend.
Historical data shows the USDT dominance chart established bottom levels around the 3.80-4% range during March 2024, December 2024, and October 2025. These timeframes aligned with Bitcoin establishing fresh all-time peak prices near $72,000, $104,000, and $126,000, respectively.