
$70K Resistance Could Extend Bitcoin's Five-Month Decline Through March
As the week drew to a close, Bitcoin supporters worked to convert three key resistance zones into support areas, though historical patterns suggest patience until next month may be required.

Bitcoin (BTC) finds itself confronting three critical resistance zones simultaneously, with the potential conclusion of the bearish phase hinging on whether these barriers can be breached during March.
Key takeaways:
- After mid-week price increases, Bitcoin continues to face three resistance zones on the weekly timeframe chart.
- February saw Bitcoin decline 14%, marking the fifth month in a row of negative price performance for BTC.
Bitcoin bulls work to convert three resistance zones to support
According to data sourced from TradingView, the BTC/USD trading pair was fluctuating near $67,720 following a rejection at the $70,000 round number threshold.
Examination of the present market framework reveals a concentration of obstacles that have consolidated into a single resistance zone, as illustrated in the accompanying chart.
At the moment of this analysis, the price recovery is being limited by the 200-week exponential moving average (EMA) positioned at $68,330, the previous 2021 all-time high located at $69,000, and the round number threshold at $70,000.
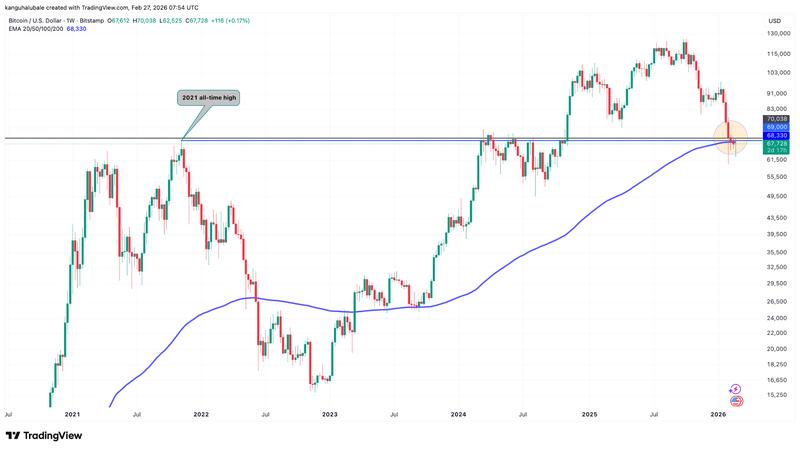
Following its Wednesday ascent to $70,040, BTC was unable to successfully recover any of these critical thresholds. Providing commentary, analyst Captain Faibik noted that a weekly candle closure above the 200-week EMA is necessary for bullish forces to sustain their upward momentum.
Should this scenario materialize, "we can then expect a bounce back toward 80k in the coming days," the analyst stated in a recent post on X, further noting:
"I think March is going to be a bullish month."
According to previous Cointelegraph coverage, the bearish phase could potentially conclude if Bitcoin's price manages to push above the cost basis of the 18-24-month age band positioned at $74,500.
Bitcoin approaches five consecutive monthly declines
Price data from historical records compiled by CoinGlass has verified that Bitcoin is experiencing its fifth straight monthly decline, with February showing a 14% drop. The previous occurrence of this pattern was observed near the conclusion of 2018 during the most severe period of that bear market cycle.
"Bitcoin is nearing a rare bearish streak," Alex mentioned in a recent post on X, further commenting:
"Last time in 2018 and 2019, the streak was followed by five strong green candles and a 4x rally."
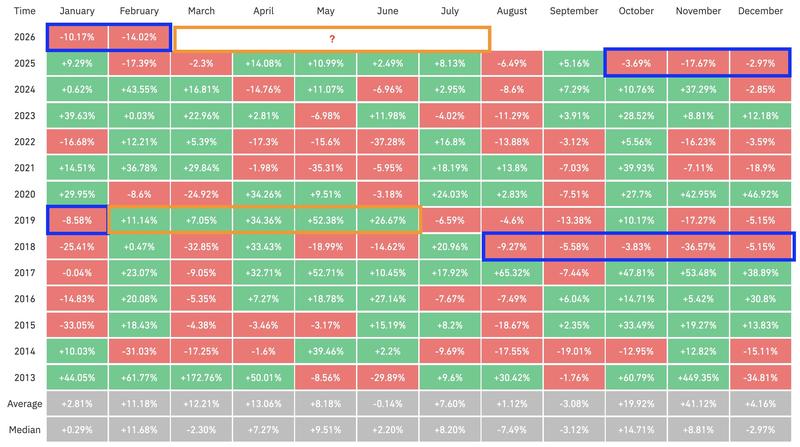
Following a 57% drop spanning from August 2018 through January 2019, Bitcoin subsequently posted five straight months of positive performance, surging 317% from $3,329 to reach $13,880.
Should historical patterns prove repetitive, the trend reversal might commence in April, especially considering that selling pressure is approaching exhaustion thresholds.