Where Will Bitcoin Find Its Bottom? Expert Forecasts Point to $30K-$50K Range
Market experts anticipate Bitcoin's bear cycle may persist through the final months of 2026, with projected bottom prices ranging from $30,000 to $50,000 according to on-chain metrics and historical cycle analysis.

On Friday, Bitcoin (BTC) experienced renewed selling pressure, driving the BTC price down 5.5% from its Wednesday peak of $70,000 to settle at $65,950 during current trading. Multiple market analysts have indicated that Bitcoin is "going much lower," with a potential cycle bottom forming during the last quarter of 2026.
Key takeaways:
- Market experts project BTC price will reach its cycle low in Q4 according to a range of technical and onchain indicators.
- Increasing exchange reserves combined with "supply in profit" declining to 2022 levels indicate additional downside risk.
Market experts predict Bitcoin price bottom formation post-June
Based on assessments from several analysts, Bitcoin may continue its downward trajectory, with potential lows ranging from $30,000 to $45,000 during the year's final quarter.
Historical data shows the briefest bear market spanned 365 days, while "Bitcoin is currently about 140 days into its current bear market," noted crypto trader Darky in a Friday X post, further stating:
"We are going much lower, just a matter of time."
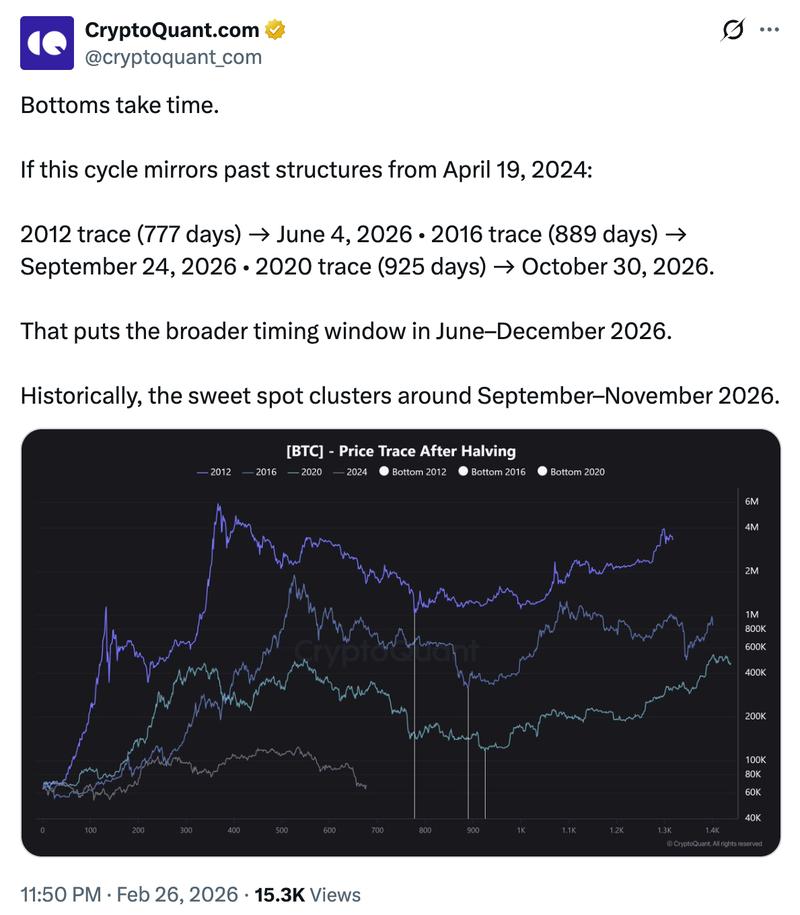
Data analytics provider CryptoQuant emphasized that "bottoms take time" to establish, projecting Bitcoin could find its cycle lows "between June and December," drawing from historical post-halving price patterns.
"Historically, the sweet spot clusters around September–November 2026."
Another market observer known as Batman noted that historical bear cycles established their bottoms 365 and 396 days following market peaks.
The current all-time high for Bitcoin exceeding $126,000 occurred on Oct. 2, 2025, with "adding 365 to 396 days puts us around October to November 2026," Batman explained, concluding:
"So whatever price we get by then, I think it's fair to say it will be a no-brainer buy."
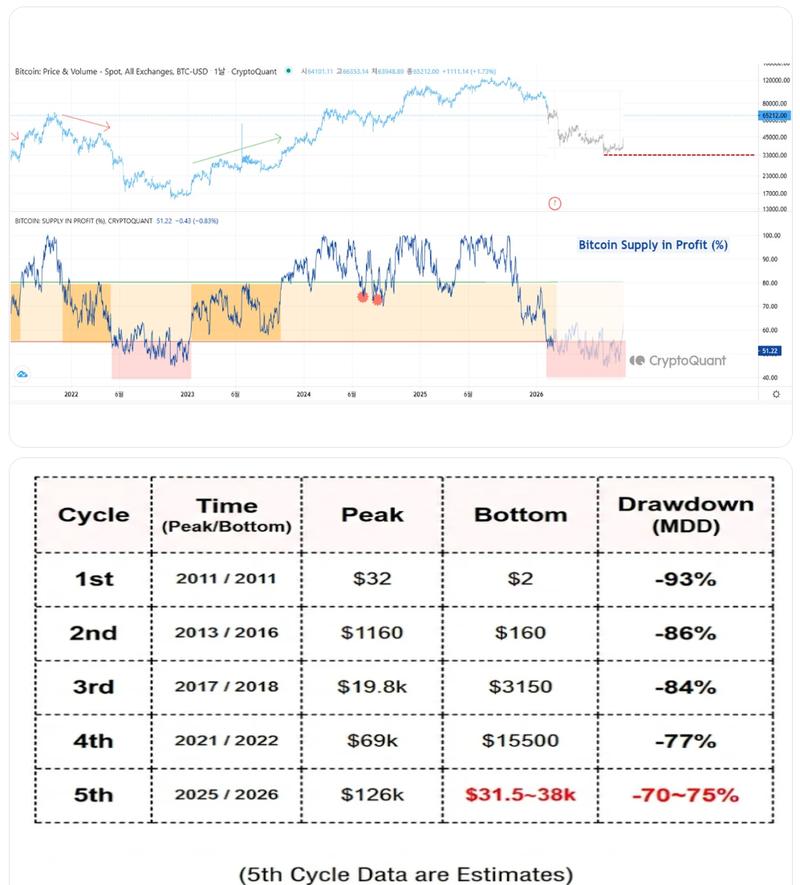
Separately, Bitcoin's "supply in profit" indicator has fallen to levels comparable with the 2022 bear market trough, based on CryptoQuant data analysis.
The 2022 bottom formation phase extended approximately six months in duration.
When the precise downward price movement from that historical period is superimposed on today's chart, it corresponds with the -70% to -75% drawdown range anticipated for the fifth cycle.
This analysis indicates Bitcoin may experience further decline from present levels, with a potential bottom forming between $31,500 and $38,000 approximately six months ahead.
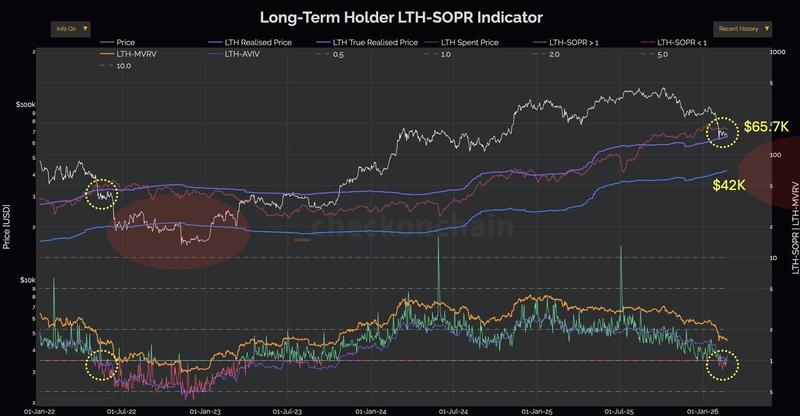
On-Chain College presented chart data revealing Bitcoin fell beneath its Long-Term Holder True Cost Basis at $65,700 and must reclaim this level for support.
These cost basis thresholds function as psychological turning points, and when prices trade underneath them, investors experience unrealized losses while distribution risk escalates.
Extended trading below this band typically amplifies investor anxiety and promotes BTC capitulation.
"History would suggest that Bitcoin is due for a trip down to $42K or lower."
As previously covered by Cointelegraph, numerous analysts anticipate 2026 will be characterized by bearish market conditions, with multiple projections forecasting BTC price declines to levels as low as $40,000.
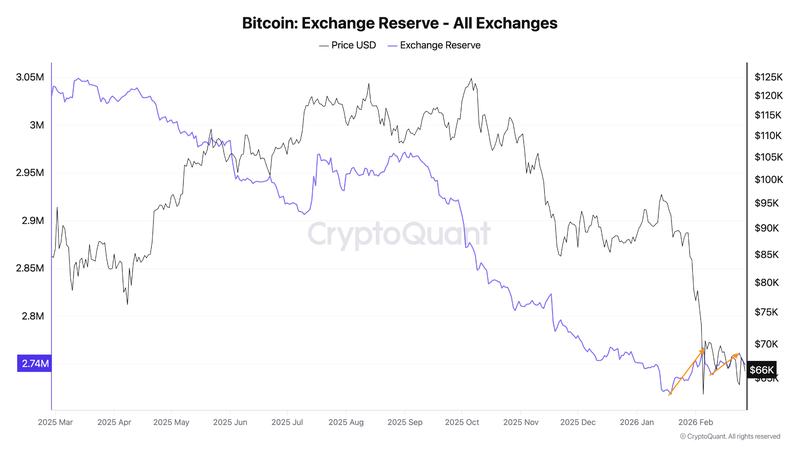
Exchange-held Bitcoin supply continues upward trend
Blockchain data from CryptoQuant indicates Bitcoin holdings on exchanges have expanded to 2.752 million BTC compared to 2.723 million in mid-January. This reflects an aggregate increase of roughly 28,489 BTC (+1.0%) across 45 days.
Growing BTC inventory on exchanges represents a traditional bearish indicator that may overwhelm demand.
"Until the reserve turns lower and breaks back below 2.723M BTC, structural selling pressure remains intact," stated analyst Axel Adler Jr. in a recent evaluation, further noting:
"The key trigger for a regime change is a sustained decline in the reserve below the January lows."