BTC surges past $70K as holders remain calm despite escalating Middle East conflict
Short-term Bitcoin holders experienced negligible losses throughout the weekend period, while Monday's climb to $70,000 indicates that the most intense selling pressure has concluded. Can Bitcoin successfully breach its monthly resistance threshold?

Bitcoin (BTC) surged to the $70,000 mark on Monday while geopolitical tensions cast a shadow across the Middle East region. According to Glassnode analytics, short-term holder loss-related transfers to cryptocurrency exchanges dropped to their lowest point in two weeks during the previous 24-hour period, representing a marked departure from the aggressive selling activity witnessed throughout early February.
Short-term Bitcoin sellers retreat from markets
The metric measuring short-term holder (STH) profit and loss (P&L) transfers to exchanges monitors the quantity of Bitcoin that recent purchasers move to trading platforms either at a gain or deficit. This particular group of market participants has historically been known to magnify price volatility during periods of market stress.
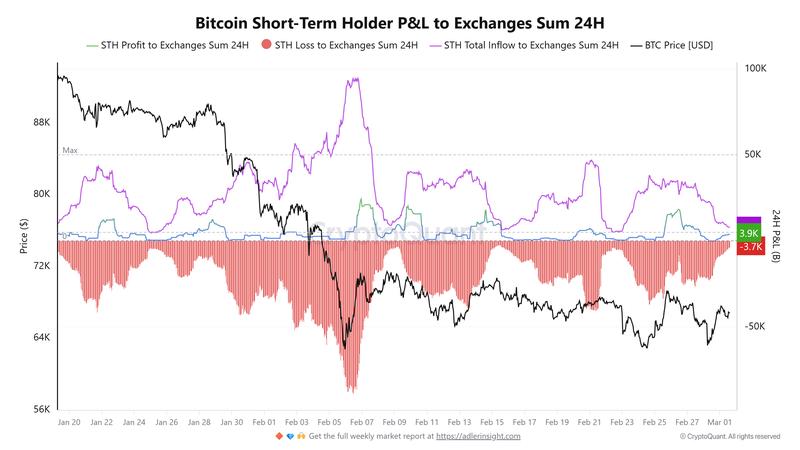
By March 1, the documented realized losses decreased to just 3,700 BTC despite mounting geopolitical friction between Iran and the United States throughout the Middle Eastern theater. Bitcoin's price fell to $63,000 during this timeframe, yet exchange deposits from this particular cohort did not increase correspondingly.
By contrast, during the Feb. 5–6 period, short-term holders transferred 89,000 BTC to exchanges while realizing losses, all within a single 24-hour span. This represented a moment of peak capitulation behavior. Following that event, the volume of loss-motivated exchange inflows has consistently diminished.
Cryptocurrency analyst MorenoDV observed that holders most vulnerable to external events have refrained from accelerating their distribution patterns and demonstrated "zero panic" response. The reduction in loss-driven transfer activity suggests that selling pressure originating from recent market entrants has substantially diminished.
Whether a robust price rally materializes may hinge on realized losses remaining at current suppressed levels versus reaccelerating toward previous capitulation thresholds amid ongoing geopolitical instability.
Bitcoin futures deleveraging encounters external liquidity zones
Data from BTC derivatives markets suggests considerable risk mitigation has occurred. Cryptocurrency analyst Darkfost pointed out that Binance's open interest contracted to 97,680 BTC from 130,800 BTC since the calendar year began, representing a 25% reduction.
The calculated leverage ratio, which evaluates open interest relative to BTC reserves held on exchanges, declined to a 0.146 weekly mean. Historical data indicates that readings beneath the 0.15 threshold have consistently coincided with intense deleveraging episodes throughout the current market cycle.
From a technical analysis perspective, Bitcoin is making an attempt to recapture its Monthly RVWAP, presently positioned near the upper-$68,000 area. The Monthly RVWAP represents a volume-weighted average price calculation anchored to the beginning of each month. When BTC trades above this indicator, it returns the average monthly market participant to profitability and frequently modifies the short-term directional bias among traders.
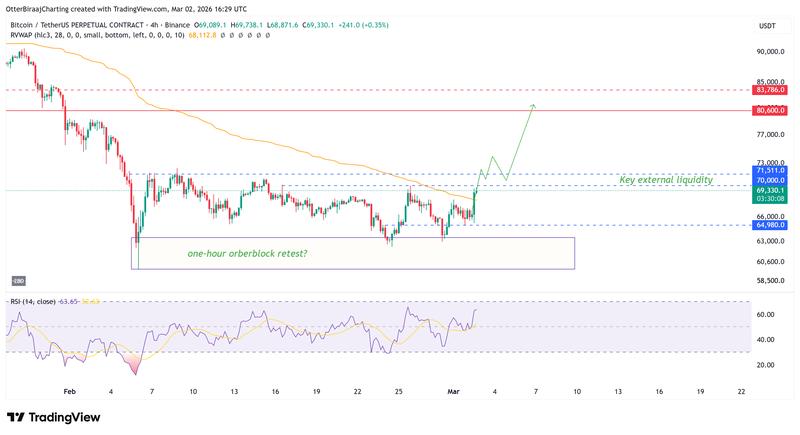
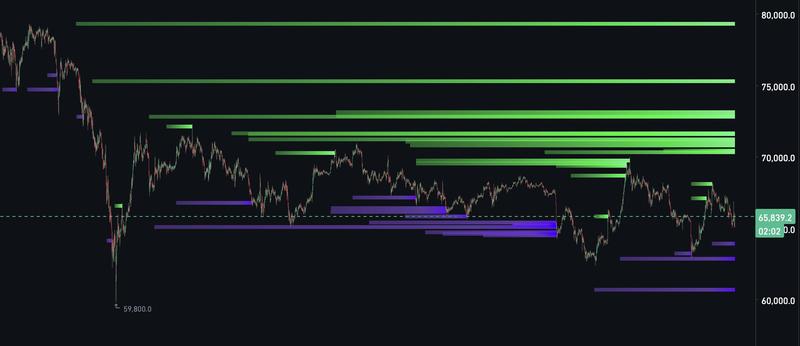
The four-hour timeframe chart illustrates price action breaking through the $70,000 level and advancing toward the initial external liquidity zone positioned between $70,000 and $71,500. Successfully transforming this price range into a support foundation could catalyze a price movement toward the $80,000 territory, where previous supply concentration prevented further upside movement in January. According to crypto trader LP,
"On the HTF, low-leverage liquidation clusters are stacking near and just above the range highs, sitting between 70–73K. These higher timeframe liquidity pools often act as magnets when they build in size."
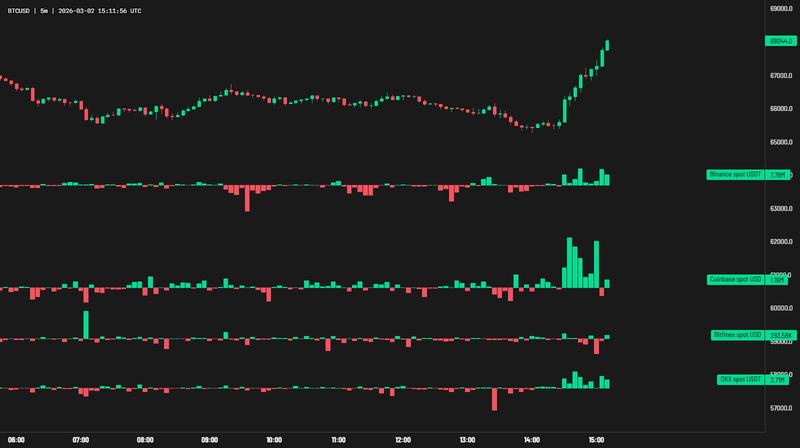
The spot flow metrics for BTC provide additional supporting context. Binance's spot market registered approximately $7.79 million in positive delta throughout the breakout movement, while Coinbase contributed around $1.16 million, and OKX accounted for nearly $3.7 million in positive flow.
The presence of positive delta measurements across multiple trading venues indicates aggressive spot market buying activity rather than activity driven exclusively by derivatives trading. Given that leverage utilization has declined and loss-motivated selling has subsided, market participants are now focusing on potential price behavior surrounding the $71,500 liquidity concentration zone.