BTC Plunges Under $63K as Markets Experience Complete Capitulation Phase
Short-term investors engaging in panic-driven sales, coupled with RSI indicators hitting near-historic lows, indicate Bitcoin may be entering a complete capitulation phase.

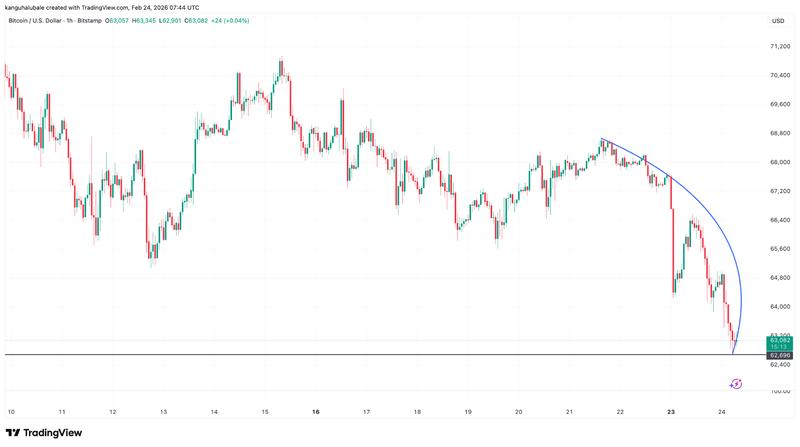
On Tuesday, Bitcoin (BTC) witnessed renewed selling pressure, with the cryptocurrency's value declining by 4% over a 24-hour period, reaching an intraday bottom of $62,700.
Market experts have indicated that Bitcoin has now moved into a phase characterized by "excess loss-realization," while the relative strength index (RSI) points toward the potential formation of a price floor.
Key takeaways:
- The capitulation among Bitcoin investors persisted, driving the BTC valuation beneath the $63,000 threshold on Tuesday.
- The weekly RSI for Bitcoin is approaching historical minimums, indicating the possibility of a market bottom.
Capitulation among Bitcoin investors persists
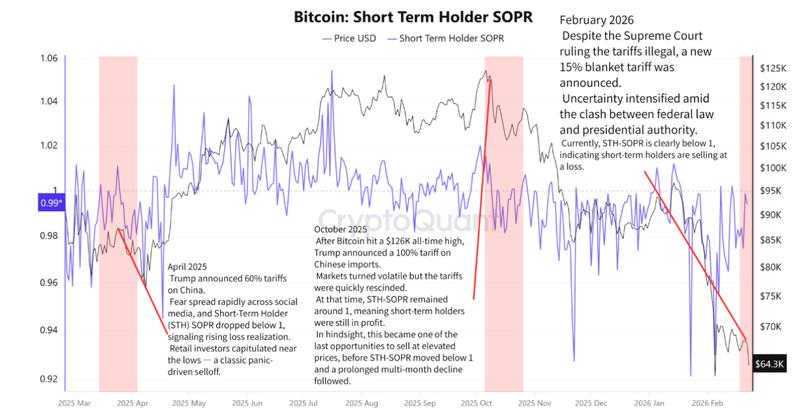
Following US President Donald Trump's Saturday announcement of a new 15% global tariff, the Short-Term Holder SOPR (STH-SOPR), an indicator that tracks whether short-term investors are realizing profits or losses on their sales, fell beneath the 1 threshold.
The metric presently stands at 0.95, indicating "renewed short-term loss realization," according to CryptoQuant analyst XWIN Research Japan in a Monday Quicktake post, who further noted:
"The primary sellers are short-term holders reacting to uncertainty, rather than long-term investors distributing structurally."
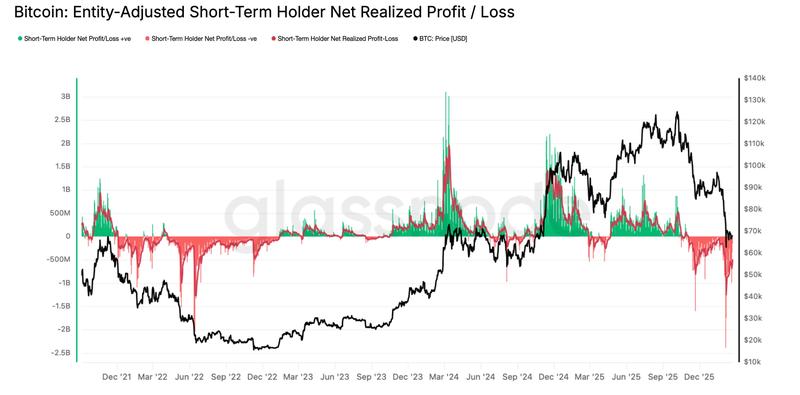
An examination of the volume of coins sold at a loss reveals that the seven-day estimated moving average (EMA) tracking Bitcoin's short-term holder net realized losses had decreased to $500 million daily, following a peak of $1.24 billion per day recorded on Feb. 6.
According to Glassnode:
"While the intensity has cooled, the broader regime still signals a market under pressure, with participants in the base formation phase continuing to capitulate."
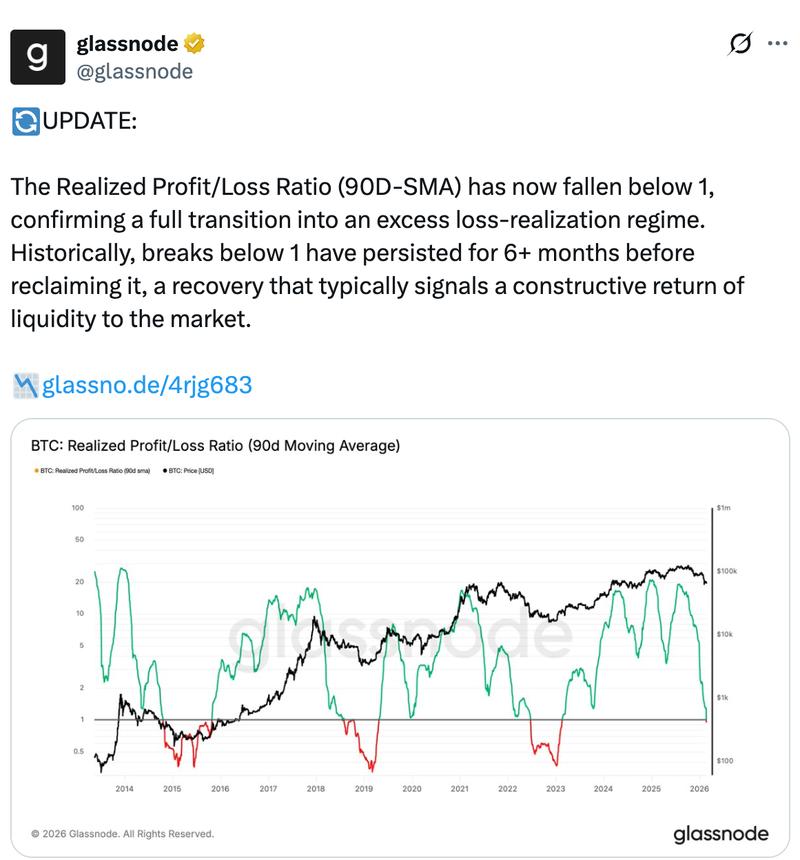
According to Glassnode, the 90-day simple moving average (SMA) tracking Bitcoin's realized profit/loss ratio has "now fallen below 1, confirming a full transition into an excess loss-realization regime."
Record "oversold" RSI levels for Bitcoin may signal bottom formation
On Tuesday, Bitcoin's weekly relative strength index, an indicator that assesses the velocity and magnitude of price fluctuations, hit its "most oversold" reading of 25.71.
Such extreme levels were previously observed on July 22, several months prior to BTC reaching a price floor of $15,500 before launching into a bullish rally.
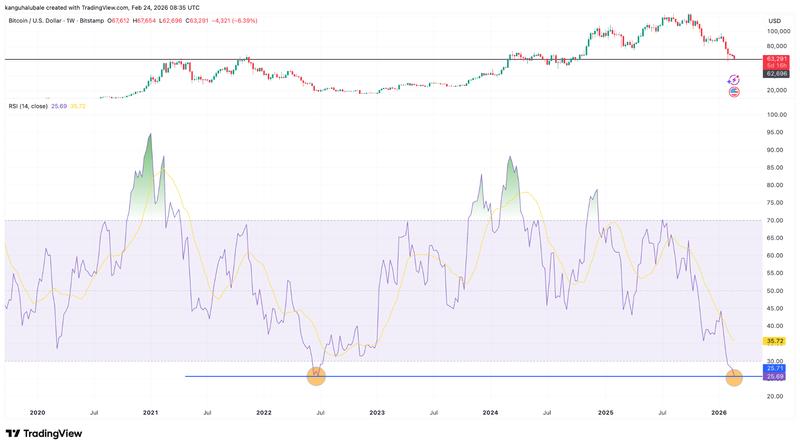
During all prior capitulation episodes where the RSI reached such exceptionally low readings, near-term price weakness was typical, yet a sustained long-term rebound materialized in each instance.
Crypto analyst Nic noted in a Tuesday X post that Bitcoin's weekly RSI represents the "most oversold it has ever been, currently at 25.6, which is lower than the previous record low level back after 3AC/Luna crash," further stating:
"More downside is likely, but a bottom could be coming soon."
According to previous Cointelegraph coverage, Bitcoin's fear and greed index has reached historical lows, while the proportion of bullish investors anticipating new all-time highs continues to diminish, potentially representing positive market signals for establishing a macro bottom.