Bitcoin Investors Capitulate at $65K: Five Critical Developments This Week
As Bitcoin demonstrates price fragility entering the new week, expectations mount for fresh BTC macro lows while market sentiment plunges to historically pessimistic territory.

As February draws to a close, Bitcoin (BTC) continues trading at fresh local lows while price projections targeting $50,000 remain firmly intact.
- Selling pressure intensifies at the weekly close for Bitcoin, with market consensus anticipating failed recovery attempts.
- Global asset markets face mounting pressure from geopolitical tensions and inflation concerns, with tariff disputes dampening investor confidence.
- Large Bitcoin holders drive exchange deposit activity, fueling predictions of a potential retest of the $60,000 level.
- Current BTC price dynamics mirror patterns observed during the 2022 bear cycle, according to onchain analytics.
- Market sentiment across crypto reaches historically pessimistic levels with the Crypto Fear & Greed Index registering merely 5/100.
Weekly close sees Bitcoin tumble beneath $65,000 threshold
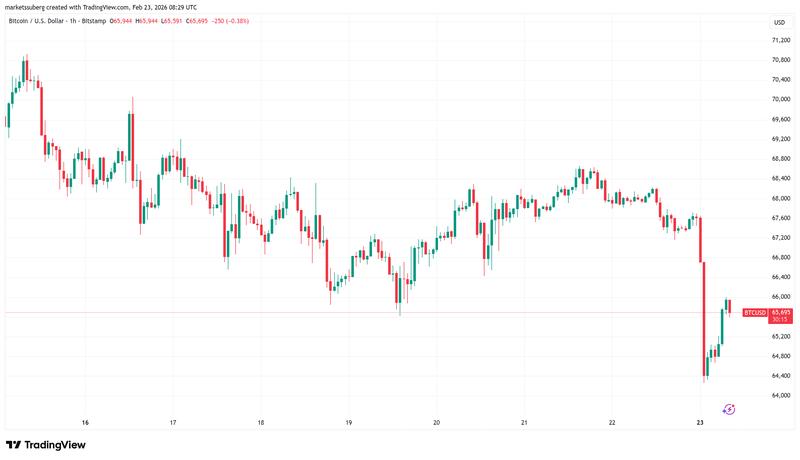
The conclusion of Sunday's weekly trading period brought immediate selling pressure to Bitcoin, pushing prices underneath the $65,000 mark before a slight stabilization occurred.
According to data sourced from TradingView, the most recent local bottom registered at $64,258 on the Bitstamp exchange, with BTC/USD maintaining nearly 3% losses as of press time.
Providing commentary, the X-based trading account Castillo Trading expressed optimism that these lower price points could represent an attractive entry opportunity for long positions. In a Monday post, the account highlighted that Bitcoin had returned to its naked point-of-control (nPOC) level — a recent high-volume zone that had not undergone prior retesting.
The nPOC positioned at $64,979 represented one among multiple critical price levels, with a corresponding chart analysis projecting potential upside movement reaching as high as $78,200.
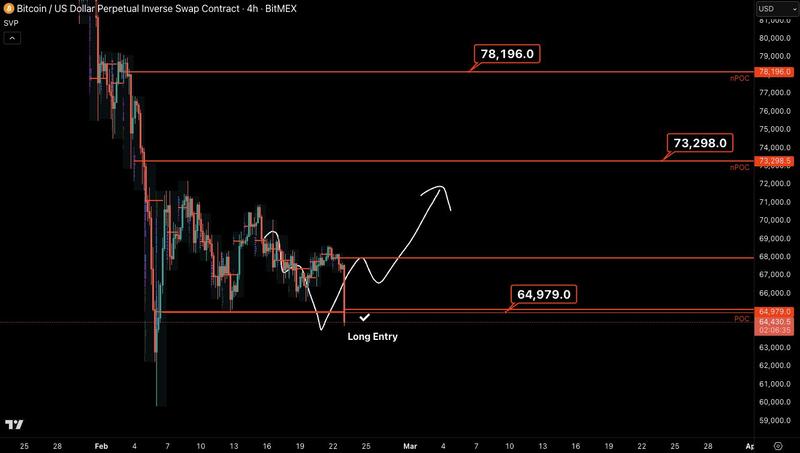
Adding to the discussion, fellow market analyst BitBull identified $76,000 as a possible resistance target before another downward move in BTC price could materialize.
Maintaining a decidedly bearish stance, however, trader Roman continued to forecast new macro lows, with current projections concentrated around the $50,000 level.
"Volume increasing while price is going down is the definition of strong bearish price action," he told X followers on Monday.
"We should expect trend to continue lower, especially to 50-52k area. Likely get a bounce there but ultimately I'm expecting lower after that."
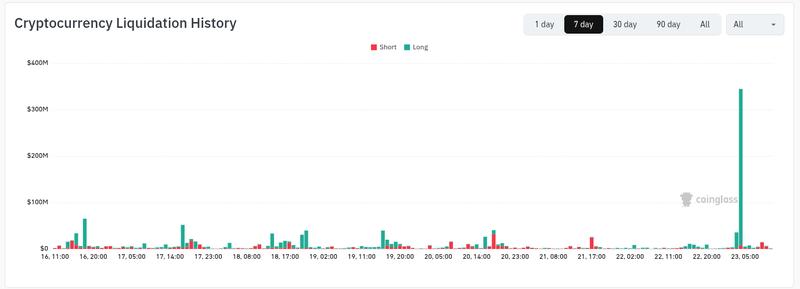
Recent figures from monitoring platform CoinGlass verified that cross-crypto liquidation events remained at elevated levels, perpetuating a trend observable throughout recent weeks. Total liquidations approached nearly $500 million during the 24-hour period leading up to the time of writing.
Tariff disputes and geopolitical instability leave markets "on edge"
A potent mixture of geopolitical instability and inflationary pressures appears poised to generate volatile conditions for cryptocurrency and risk-oriented assets throughout the current week.
Escalating tensions regarding Iran form the geopolitical foundation while markets simultaneously digest the impact of fresh global trade tariffs implemented by US President Donald Trump.
Following last week's Supreme Court determination that certain tariff implementations violated legal standards, Trump committed to mounting a challenge, with US stock futures beginning the week with downward momentum following announcements of a 15% replacement tariff structure.
"We have a busy week ahead," trading resource The Kobeissi Letter informed X followers, characterizing market conditions as "on edge."
Bitcoin itself experienced comparable downward pressure, sustaining these conditions into Monday's Wall Street trading session and prompting warnings of additional price deterioration.
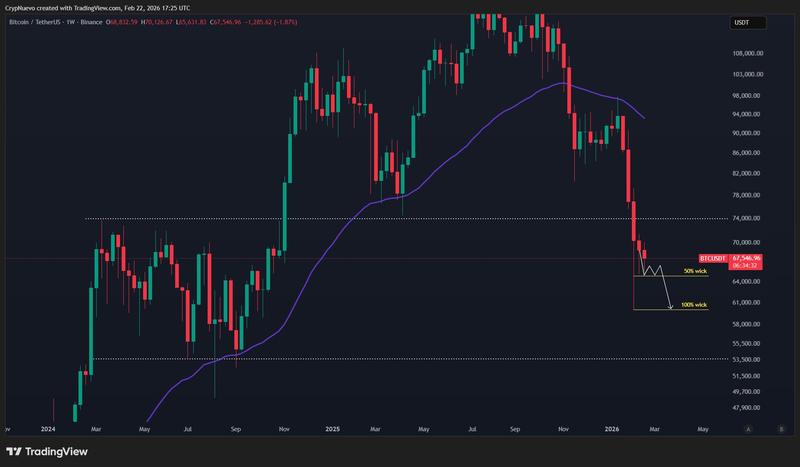
"It's possible that over the next two weekends, the US-Iran conflict escalates, as a new way to divert attention from the Supreme Court ruling that declared the previous tariffs illegal. Bearish uncertainty," trader CrypNuevo wrote in an X thread on BTC price action.
CrypNuevo presented the argument that BTC/USD should endeavor to "fill" its daily candle wick extending to sub-$60,000 levels from early February.
"I think price could reach $61k within 2-3 weeks (-10%)," the trader said.
As the week progresses, market participants await the January release of the Producer Price Index (PPI), with the preceding two monthly reports both exceeding forecasted estimates.
According to Cointelegraph's prior reporting, the previous week's Personal Consumption Expenditures (PCE) data similarly demonstrated accelerating inflation.
"The rally in commodity indexes threatens further upside pressure on inflation."
Large holder deposit activity suggests "significant selling" approaching
Major Bitcoin holders maintain their selling inclination at prevailing price levels, according to fresh analysis examining exchange flow dynamics.
Within a "Quicktake" blog publication for onchain analytics provider CryptoQuant, contributor GugaOnChain disclosed that whale entities continue transferring substantial Bitcoin quantities to trading platforms.
Deposit activity in particular demonstrates whale dominance, with CryptoQuant's Exchange Whale Ratio indicator reaching 70%.
"Historically, levels above 70% have preceded significant selling movements, as whales use exchanges to realize profits," GugaOnChain wrote.
"At the same time, an atypical movement is observed: old coins are returning to platforms in large volume, while short-term holders continue to realize losses, creating a hybrid supply scenario that tends to push Bitcoin's price toward lower levels."
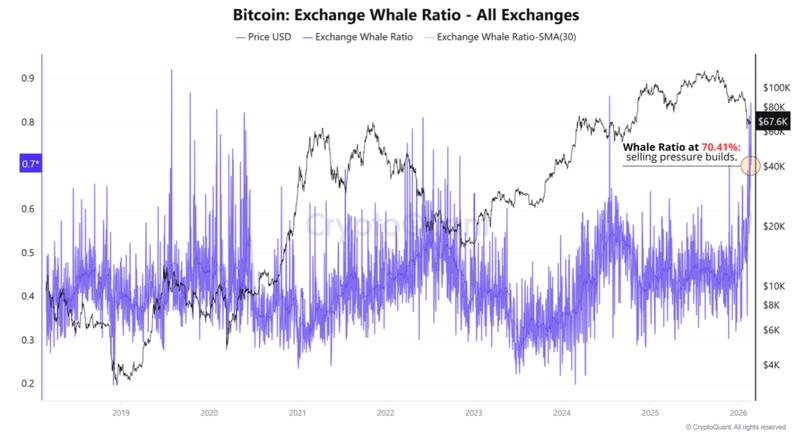
The outcome manifests as "strategic tension" — motivated sellers coupled with expanding BTC supply accessibility, while buyer participation remains insufficient to absorb available supply.
GugaOnChain consequently forecasts an "imminent flush toward BTC's immediate support in the $60K region."
"With supply on the rise, caution is warranted," he concluded.
Parallels to 2022 bear cycle blueprint remain active
As comparisons to the 2022 bear market proliferate, an important BTC price indicator delivers warning signals.
CryptoQuant analysis of Anchored Volume-Weighted Average Price (AVWAP) currently signals "bearish confluence" between price movements and onchain metrics.
Throughout Bitcoin's early February decline, the asset closed beneath its AVWAP — representing the price level associated with the highest average volume calculated from its most recent block subsidy halving event in 2024.
"The last time a similar bearish confluence was observed after an ATH was in May 2022," contributor Facundo Fama noted.
Supporting visual data illustrated one of CryptoQuant's proprietary analytical tools, quantifying expansion in Bitcoin's market capitalization relative to its realized capitalization. Present readings position the metric deep within "bear market" classification.
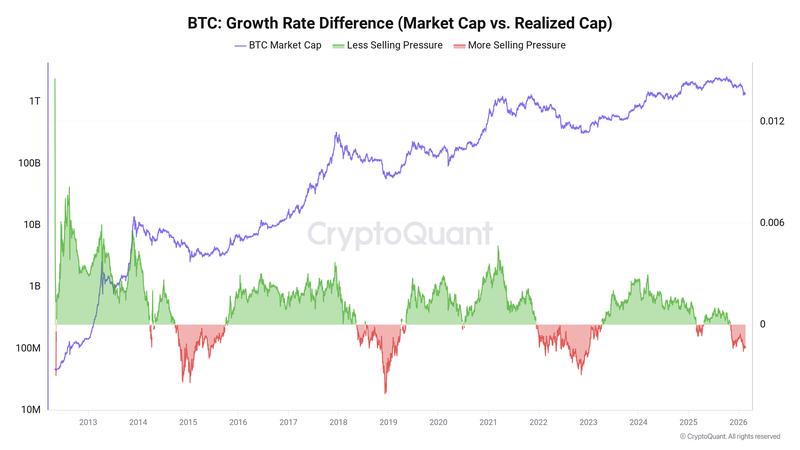
Previously, Cointelegraph provided coverage of multiple realized price thresholds now attracting attention as BTC/USD works to establish its subsequent long-term support foundation.
Market sentiment across crypto matches all-time pessimistic readings
While Bitcoin price performance has yet to revisit its 15-month lows established at the beginning of the month, the prevailing atmosphere of pessimism maintains unprecedented intensity.
This condition finds reflection in current measurements from the Crypto Fear & Greed Index, a traditional market sentiment assessment tool that continues displaying significant divergence from its traditional finance counterpart.
Fear & Greed descended to merely 5/100 on Monday, signifying "extreme fear" and equaling its lowest recorded measurements in the indicator's history.
"People have given up," independent analyst Cryptoinsightuk reacted on X.
"I had never seen a 5 on Fear and greed index before this past month. Now I've seen multiple."
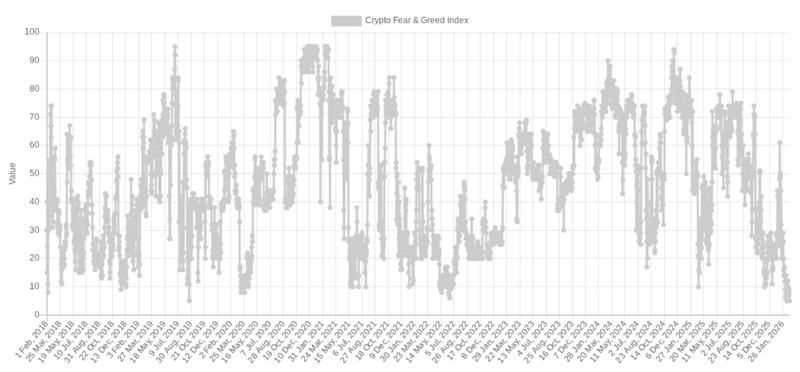
Pseudonymous trading professional and investor BitcoinHyper noted that cryptocurrency markets have now sustained conditions within the "extreme fear" classification for a duration exceeding any comparable period since the 2022 bear market cycle.
The conventional Fear & Greed Index, which monitors equity markets, presently registers just within "fear" classification at 43/100. During the initial occasion when sentiment registered 5/100, the regular Fear & Greed indicator bottomed at 33/100 prior to recovering.