Bitcoin Investors Show Strength at Current Levels, Yet Glassnode Warns of Potential 20% Drop
Analysis of blockchain data reveals Bitcoin trapped between critical price valuation points while investor accumulation volume climbed beyond 4 million BTC. However, weakening liquidity indicators suggest additional downward pressure may be ahead.

The market structure for Bitcoin (BTC) transitioned into a corrective mode following the breach of a critical onchain valuation threshold during the final weeks of January.
According to data from Glassnode, BTC's valuation is experiencing compression within a demand zone that originated in 2024, occurring as liquidity metrics show signs of deterioration. Simultaneously, the distribution of BTC's supply continues its gradual migration toward long-term holding wallets associated with retail investors, even as trading volumes on exchanges have diminished.
The combination of these technical indicators and onchain metrics, together with ongoing capital movement patterns, could potentially determine Bitcoin's subsequent price trajectory.
Bitcoin breached its active supply cost basis, yet investors maintain support at $60,000
Within their weekly analytical report titled "The Week On-chain," Glassnode explained that BTC's current price decline gained momentum after falling beneath its true market mean positioned around $79,000 during January, representing the average cost basis for monitored active supply.
Following this breakdown, the asset price has found equilibrium within a concentrated trading corridor spanning $60,000 to $69,000, an area currently being protected by holders with medium-term investment horizons. A key factor contributing to this zone's robust support characteristics stems from the maturation period of coins acquired within this price range throughout the greater part of 2024.
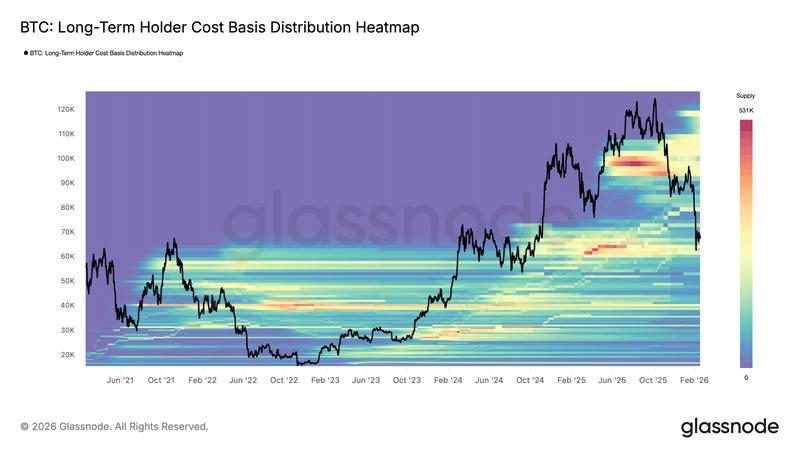
Bitcoin acquired throughout that price corridor has matured beyond the 155-day threshold, positioning a substantial investor cohort near their breakeven points. From a technical perspective, this supply distribution has effectively moderated additional downward selling momentum.
Cryptocurrency market analyst Ardi identified a comparable market pattern, commenting on X,
"We're trading inside the same $53-73K range that took 245 days to build last year. Think about how much volume went through this zone. This is the most contested zone on BTC's entire chart right now."
Glassnode's analysis further emphasized that throughout previous market cycles, more severe bearish phases have typically gravitated downward toward the realized price level, currently situated near $54,900. This particular metric provides an estimate of the mean acquisition price for all Bitcoin currently in circulation.
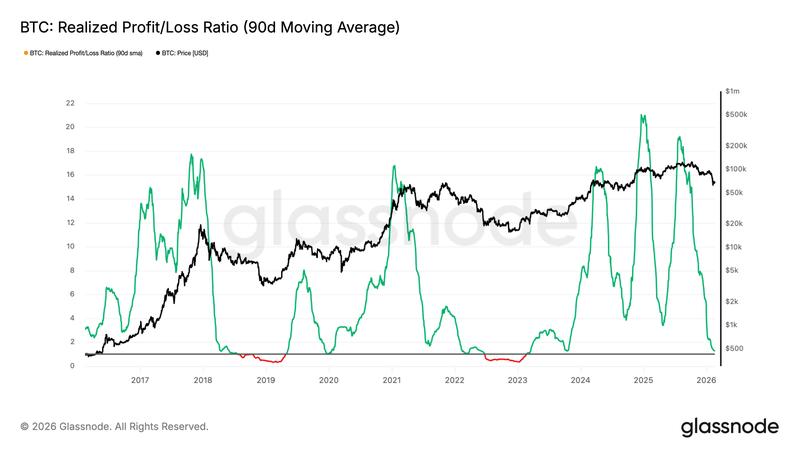
The liquidity environment surrounding Bitcoin also continues to display constrained characteristics. The 90-day measurement of the realized profit/loss ratio has contracted back within the 1–2 range, a threshold historically correlated with restricted capital movement. Extended periods trading below 1 have previously coincided with challenging bear market conditions.
BTC accumulation trends upward despite declining network activity
Analysis from CryptoQuant demonstrates that wallet balances associated with accumulating address categories have maintained their upward trajectory extending into early 2026. The aggregate BTC quantity held by these investor cohorts has grown to exceed 4 million BTC, representing a significant increase from approximately 2 million BTC recorded in early 2024, which demonstrates consistent supply absorption patterns.
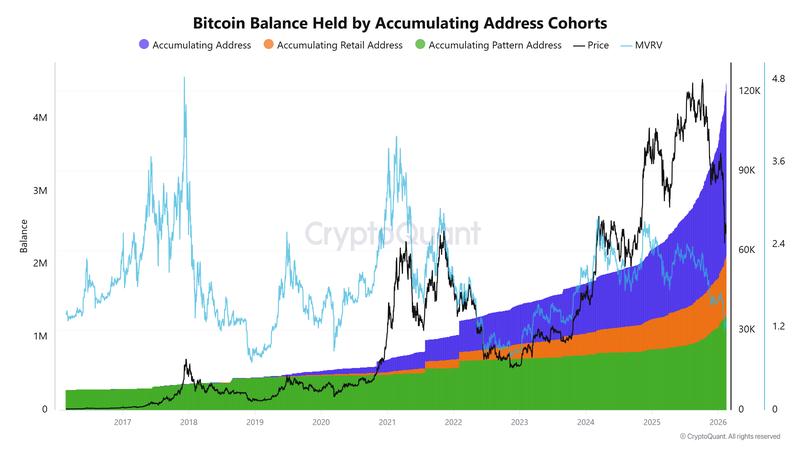
Addresses associated with retail accumulation behavior have expanded their Bitcoin holdings by 850,000 BTC, whereas wallets exhibiting systematic accumulation patterns—characterized by addresses that consistently acquire BTC through regular intervals while maintaining minimal outbound transfers—have increased their aggregate position to 1.27 million BTC. This growth phenomenon persisted throughout 2026 despite declining price levels.
Conversely, transaction volumes originating from centralized exchange addresses and wallets demonstrating high-frequency activity patterns have experienced moderation. When compared against the expansion phases spanning 2023 through 2024, during which inflow surges regularly surpassed the 1.2 to 1.5 million BTC threshold, contemporary activity levels have remained considerably subdued, maintaining averages within the 300,000 to 400,000 BTC range.
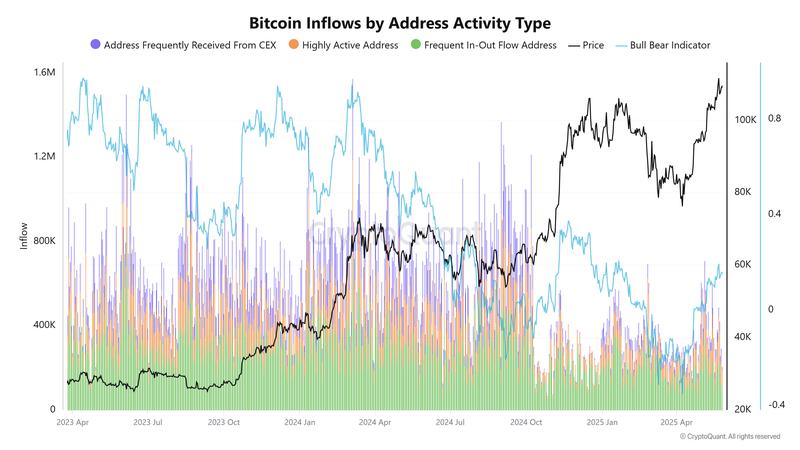
This observable divergence indicates that increasing quantities of BTC are transitioning into long-term holding wallets even as fewer coins circulate through principal cryptocurrency exchanges. This pattern effectively diminishes the available liquid supply while simultaneously decelerating short-term trading velocity.