
Traders Face Mass Liquidations As Bitcoin Volatility Spikes During US Banking Holiday
Rapid price movements above and below key levels trigger trader liquidations as Bitcoin struggles to maintain support at the $70,000 threshold.

Both long and short positions in Bitcoin (BTC) were eliminated throughout Monday's trading session as thin volume conditions created sudden volatility bursts.
Key points:
- Lower time frame price manipulation during the US banking holiday resulted in liquidations across both long and short Bitcoin positions.
- Price movements delivered "fakeouts and shakeouts" to traders despite remaining confined within a tight trading range.
- Analysts draw parallels to the 2022 bear market cycle, with particular attention to weekly RSI indicators.
Liquidity hunting drives BTC trader liquidations
TradingView data revealed rapid price swings contained within a confined BTC price corridor during the US banking holiday, with the upper boundary reaching $70,000.
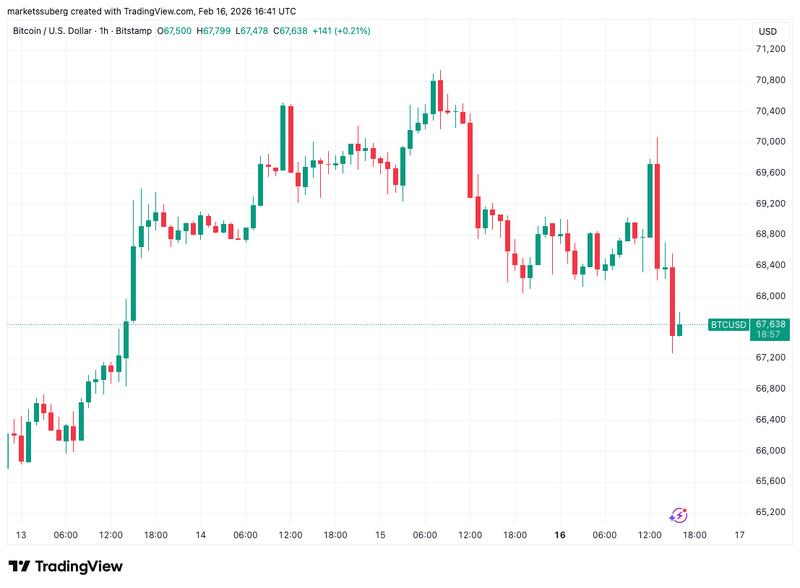
The closure of Wall Street trading created reduced liquidity conditions in order books across the board, enabling high-volume market participants to exert greater influence over near-term price movements. The outcome was a series of rapid "squeezes" that caught both long and short position holders off guard.
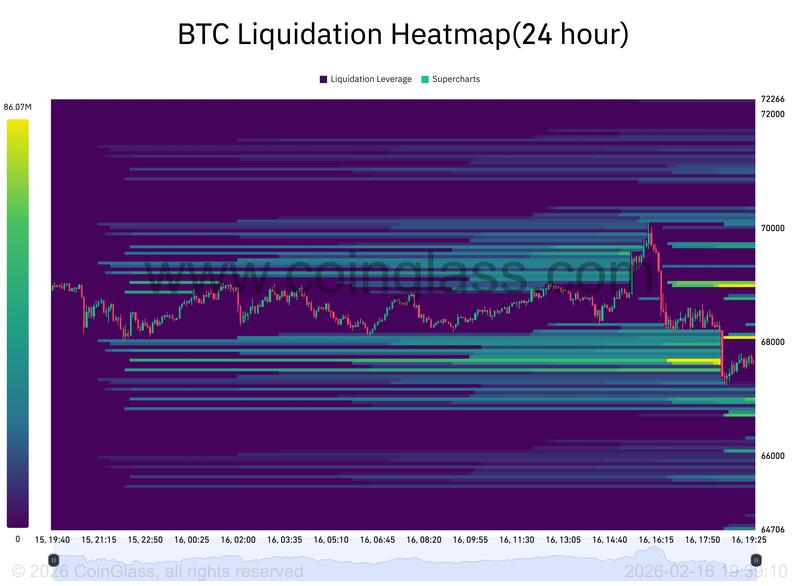
Information from CoinGlass, a market monitoring platform, indicated that cryptocurrency liquidations totaled $120 million during the four-hour period leading up to publication time.
Throughout the trading day, clusters of bid and ask orders were systematically cleared, while fresh order book "walls" materialized directly above price levels as they declined, intensifying the downside momentum.
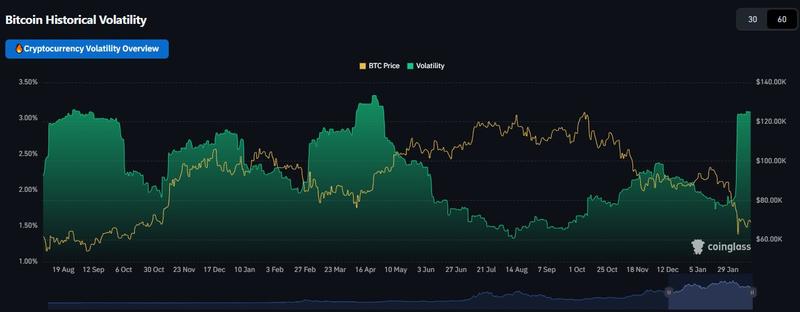
"Volatility is much higher which is something that we also see in pretty much all other markets lately. Definitely not a calm period for markets around the world," trader Daan Crypto Trades commented in a post on X.
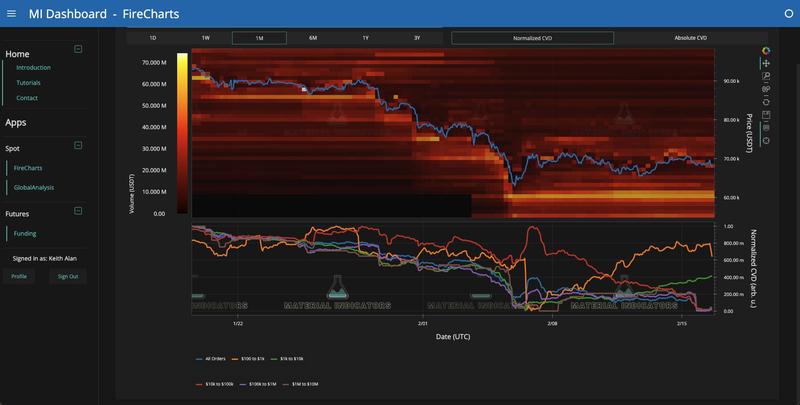
Material Indicators, a trading analysis resource, characterized the recent BTC price behavior as "breakouts and shakeouts."
A corresponding analytical chart tracked both order book liquidity levels and large holder activity on the BTC/USDT trading pair at Binance.
Trader CW nonetheless observed that buying pressure was more robust than on Sunday, with the exception of exchange OKX.
Weekly RSI indicators suggest "once per cycle lows" territory
Maintaining focus on broader market dynamics, Keith Alan, cofounder of Material Indicators, highlighted persistent parallels between current market conditions and Bitcoin's 2022 bear market cycle.
He noted that relative strength index (RSI) measurements on weekly charts were signaling potential BTC price bottom formation.
"Finding more similarities with 2022 in the $BTC chart as Weekly RSI moves towards what has historically been, once per cycle lows in oversold territory," he told X followers.
"In 2015 and 2018 it marked bottom, however in 2022 it led to a 5 month consolidation before establishing a macro bottom."
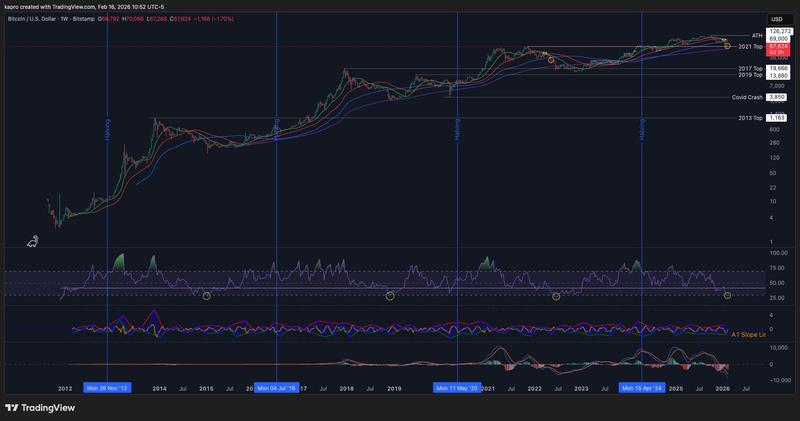
The weekly RSI registered 27.8 on Monday, representing the most depressed level observed since June 2022. Technical analysts generally classify readings beneath 30 as "oversold."
"This doesn't mean it has to develop the same way this time, but it's worth watching closely to identify similarities and deviations in the pattern to help with forecasting," Alan added.