SOL's 10% surge spearheads broader crypto market rebound: Could $100 be on the horizon?
Technical analysis and onchain data point to Solana potentially climbing toward $110-$115, fueled by bullish indicators across multiple metrics.
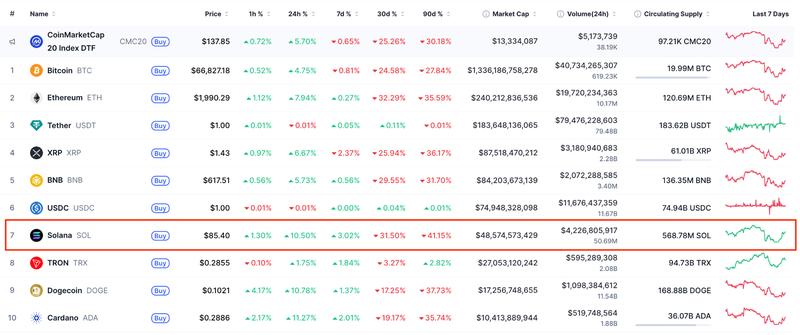
In the past 24 hours, Solana's native token SOL has experienced a remarkable 10% increase, climbing to an intraday peak of $86 during Wednesday's trading session.
This upward movement coincided with a notable surge in derivatives market activity, as SOL's open interest climbed by over 5% to reach $5.27 billion.
Market observers are now scrutinizing the near-term chart patterns and blockchain fundamentals that could indicate a critical inflection point for SOL's trajectory.
Key takeaways:
- SOL price has climbed 10% in 24 hours, driven by overall market optimism and inflows into Solana ETF products.
- A symmetrical triangle breakout pattern on Solana's chart points to a $110 SOL price objective.
SOL rebounds alongside broader cryptocurrency market
The SOL/USD trading pair surged by as much as 13.6% to reach $86 on Wednesday, bouncing from a two-week bottom of $75 recorded on Tuesday, as part of an industry-wide upswing.
Bitcoin (BTC), the largest cryptocurrency by market capitalization, was changing hands at $66,800 during the time of publication, registering a 5% increase over the previous 24 hours. Ether (ETH), ranked second by market cap, has climbed approximately 8% on the day to trade marginally above $1,990. XRP has similarly recorded notable daily appreciation among the top 10 digital assets, rising 6% during the same timeframe.
Consequently, the total global cryptocurrency market capitalization has increased 4% on the day to reach $2.28 trillion on Wednesday.
Today's rally in Solana has been accompanied by substantial liquidations of short positions amounting to $15.4 million in the last 24 hours, indicating strong buying pressure from market participants.
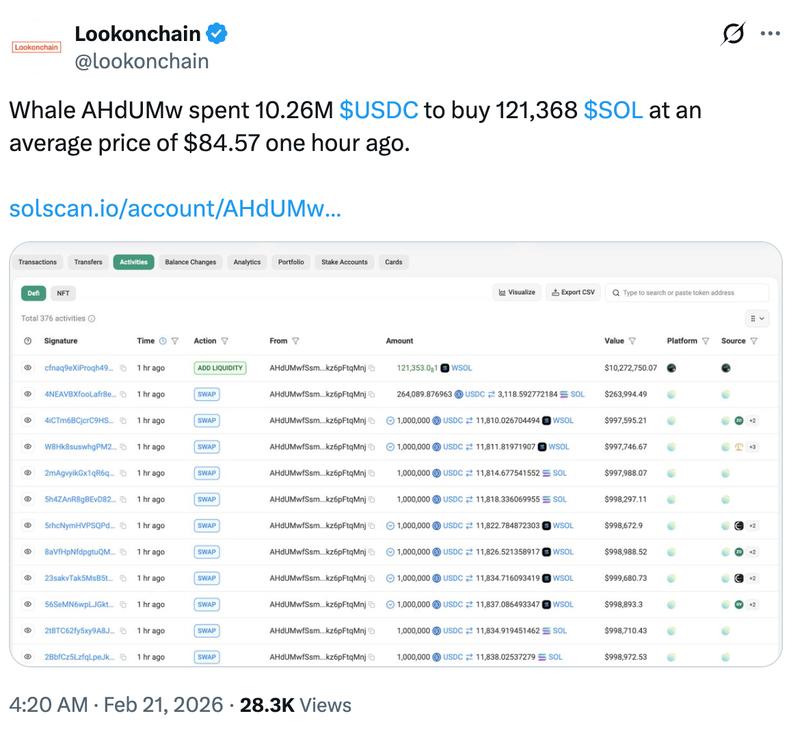
Contributing to the demand side were US-based spot Solana ETFs, which have accumulated $40 million in net inflows beginning Feb. 9.
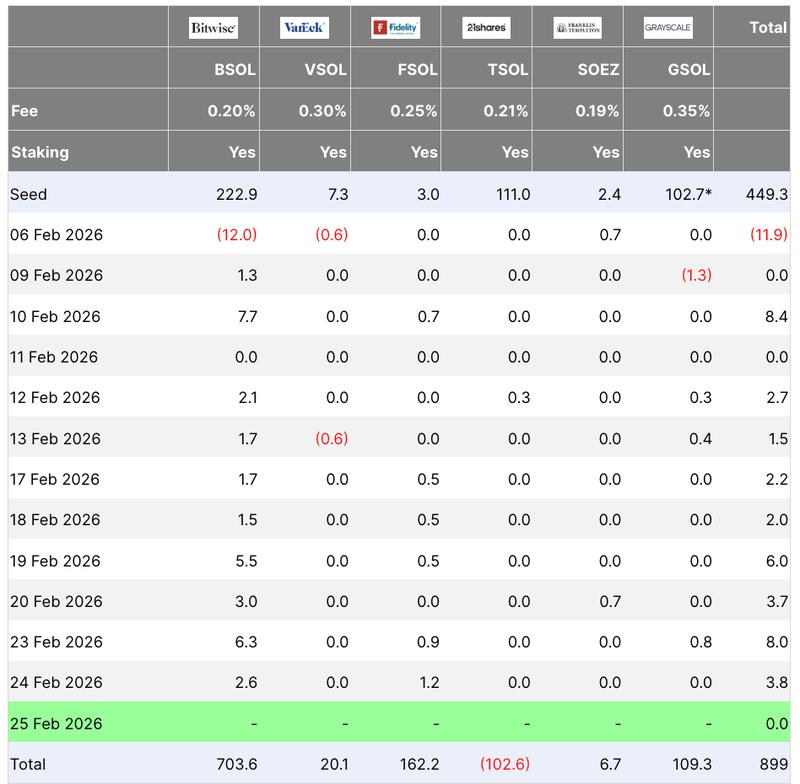
The intensifying demand-side momentum has the potential to propel SOL prices even higher, particularly when combined with expanding inflows from worldwide Solana investment vehicles and accumulation by large holders.
Symmetrical triangle pattern on SOL chart suggests $110 target
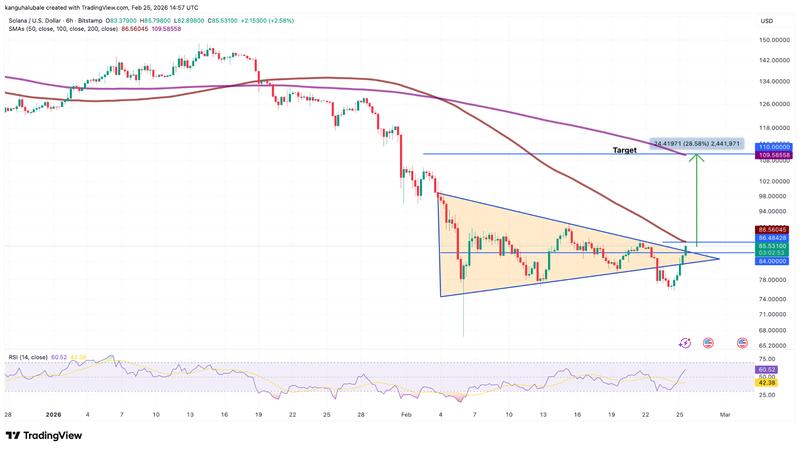
Information from TradingView reveals SOL price moving beyond a symmetrical triangle formation on the six-hour chart timeframe, as illustrated in the accompanying chart.
To maintain the bullish trajectory, the price must establish a close above the 100-day simple moving average (SMA) positioned at $86.
The measured objective of this chart pattern, determined by adding the triangle's height to the point of breakout, stands at $110, aligning with the 50-day SMA. This would represent a 28.5% advance from current price levels.
As previously documented by Cointelegraph, a daily candlestick closing above the 20-day EMA, presently positioned at $88, would pave the way for an advance toward $95 and subsequently to $117.
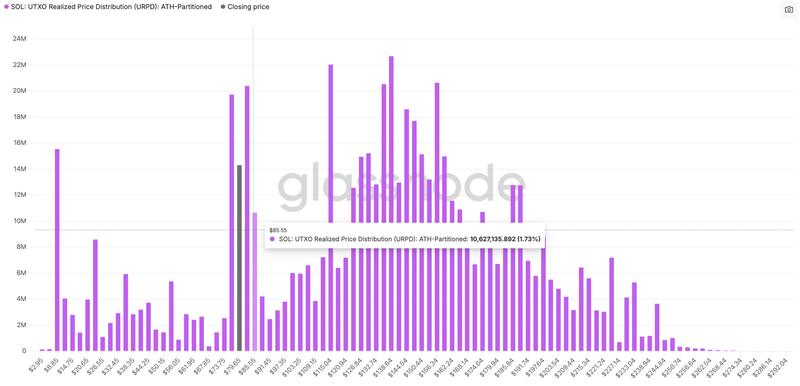
Analysis of Glassnode's realized price distribution metrics for Solana reveals minimal historical purchase activity above $85, indicating that bullish forces could readily penetrate this resistance level.
Put differently, relatively few SOL token holders have an acquisition cost basis above this price zone, diminishing the probability of significant selling pressure until the price advances toward higher supply concentrations.
The subsequent major resistance level is located at $115, where roughly 22 million SOL tokens were historically purchased.