
Market Analysis 2/9: SPX, DXY, BTC, ETH, BNB, XRP, SOL, DOGE, ADA, BCH Price Forecasts
Major altcoins and Bitcoin remain under pressure as sellers continue to dominate near resistance zones. Are technical indicators suggesting BTC and top altcoins are establishing a market bottom?
Key points:
- The recovery attempt in Bitcoin is encountering resistance around $72,000, though bulls have managed to maintain their positions without significant losses to bearish forces.
- Major altcoins continue to meet resistance at elevated price levels, suggesting bearish sentiment persists across the market.
Bitcoin (BTC) has declined toward $69,500, showing that sellers are actively engaging on upward price movements. Multiple market analysts maintain the view that BTC has not yet established its bottom. In a post on X, trader BitBull stated that BTC's "real bottom will form below $50,000, where most of the ETF buyers will be underwater."
An alternative perspective was presented by crypto sentiment platform Santiment. In their Saturday report, the Santiment team indicated that available data points to the $60,000 drop potentially representing a genuine market bottom. Nevertheless, for a sustained upward movement to occur, the market must hold above critical support levels, while whales need to maintain their tentative accumulation patterns.
Additional encouraging signs for bulls include the BTC Sharpe ratio declining to -10, a level that historically corresponds with the concluding stages of bear markets, as noted by CryptoQuant analyst Darkfost. While these metrics don't definitively confirm the bear market's conclusion, they suggest the risk-to-reward balance may be approaching extreme territory.
Will BTC and leading altcoins initiate a robust relief rally, or is the downward trend set to continue? Let's examine the charts of the top 10 cryptocurrencies for insights.
S&P 500 Index price prediction
The S&P 500 Index (SPX) dropped beneath the ascending channel pattern on Thursday, yet bulls managed to prevent sustained trading at lower price levels.

The index mounted an aggressive comeback on Friday, surging past the moving averages. This development suggests the channel breakdown may have functioned as a bear trap. Bulls are now expected to attempt driving the price toward the resistance line, where bearish forces are anticipated to enter the market.
The 20-day exponential moving average (6,917) is showing signs of flattening, while the relative strength index (RSI) hovers just above the midpoint, indicating equilibrium between buying and selling pressure. A successful close above the resistance line could initiate the subsequent leg of the upward trend targeting 7,290.
US Dollar Index price prediction
The US Dollar Index (DXY) climbed above the 20-day EMA (97.67) on Thursday, though bulls were unable to maintain these elevated levels.
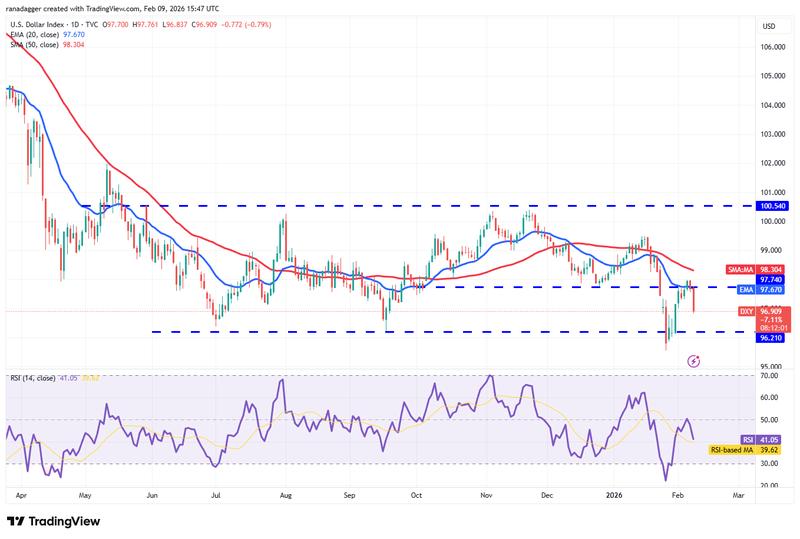
The price experienced a sharp decline below the 20-day EMA on Monday, indicating bears are making efforts to seize control. Substantial support exists in the 96.21 to 95.51 support zone, though if bears succeed in breaking through, the index could tumble to 91.88.
Alternatively, if the price rebounds sharply from current levels or from the support zone and climbs above the moving averages, this would signal the index may continue trading within the 96.21 to 100.54 range for an extended period.
Bitcoin price prediction
BTC's upward recovery is encountering resistance just beneath the breakdown level of $74,508, suggesting bears are working to convert this level into resistance.
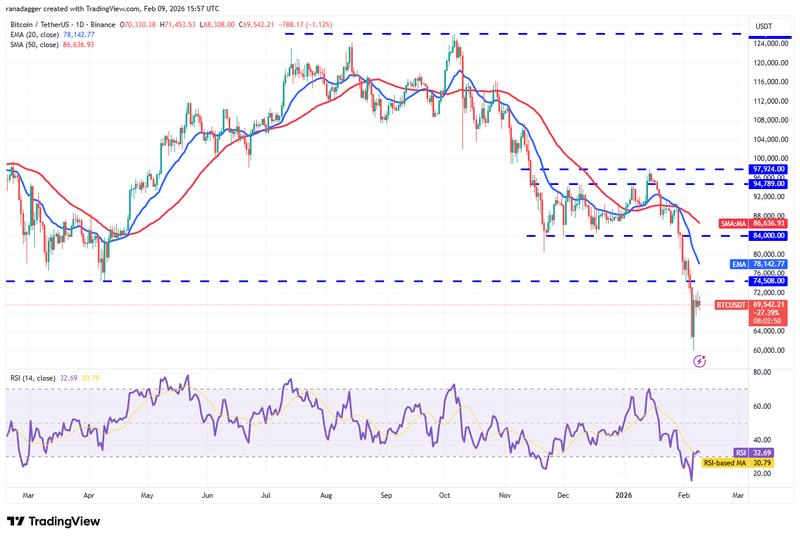
The declining 20-day EMA ($78,142) combined with the RSI positioned in negative territory suggests sellers maintain the advantage. Should the price reverse downward from $74,508 or the 20-day EMA, bears will make another attempt to drive the BTC/USDT pair down to $60,000.
This bearish outlook will be negated in the short term if the Bitcoin price manages to break above the 20-day EMA. Such a move would indicate strong buying interest at lower price levels. The pair could then advance toward the 50-day SMA ($86,636).
Ether price prediction
Ether's (ETH) recovery attempt is meeting resistance at the $2,111 level, though an encouraging sign is that bulls have maintained most of their ground against bearish pressure.
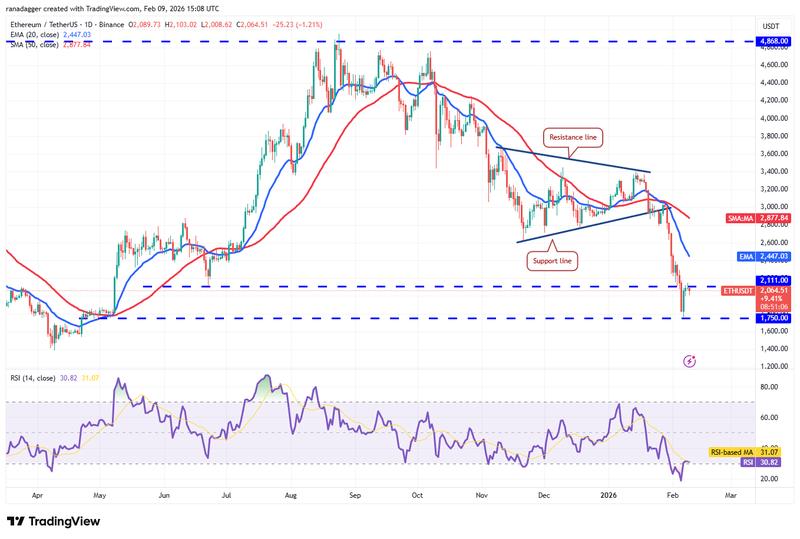
If the price achieves a decisive close above the $2,111 level, the ETH/USDT pair could advance to the 20-day EMA ($2,447). This represents a critical resistance level worthy of close attention, as a breakthrough above it would suggest diminishing bearish momentum. The Ether price could then advance to the 50-day SMA ($2,877).
Sellers must aggressively protect the $2,111 level to preserve their advantage. Should they accomplish this, the $1,750 level could be vulnerable to breakdown. The pair might then decline to $1,537.
BNB price prediction
BNB's (BNB) recovery attempt is encountering selling pressure near the 50% Fibonacci retracement level of $676, reflecting negative market sentiment.
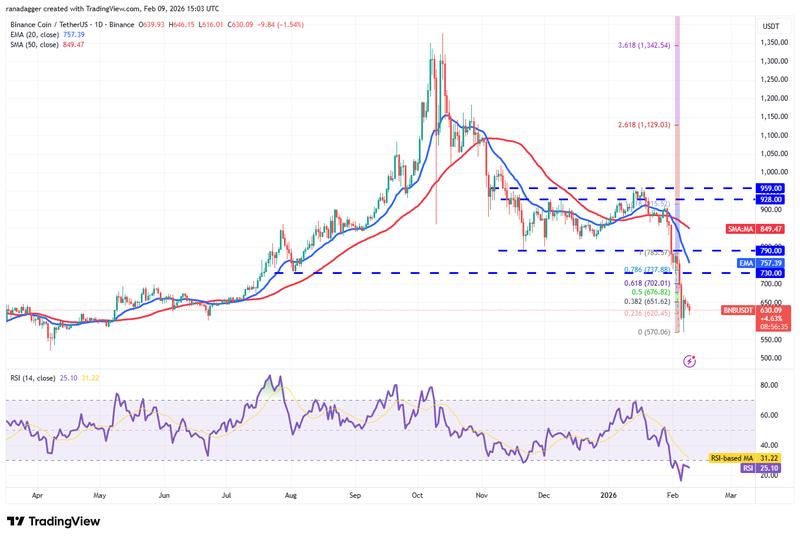
If the price falls below $602, bears will work to drag the BNB/USDT pair beneath the $570 support level. Success in this endeavor could result in the pair plummeting to $500.
On the other hand, if bulls succeed in pushing the BNB price above $676, the pair may climb to the breakdown level of $730. Sellers are likely to defend the $730 to $790 zone, as a breakthrough above this area would suggest bulls have regained control. The pair could then surge to the 50-day SMA ($849).
XRP price prediction
Buyers have successfully maintained XRP (XRP) above the support line of the descending channel pattern but are encountering difficulty pushing the price to the 20-day EMA ($1.63).
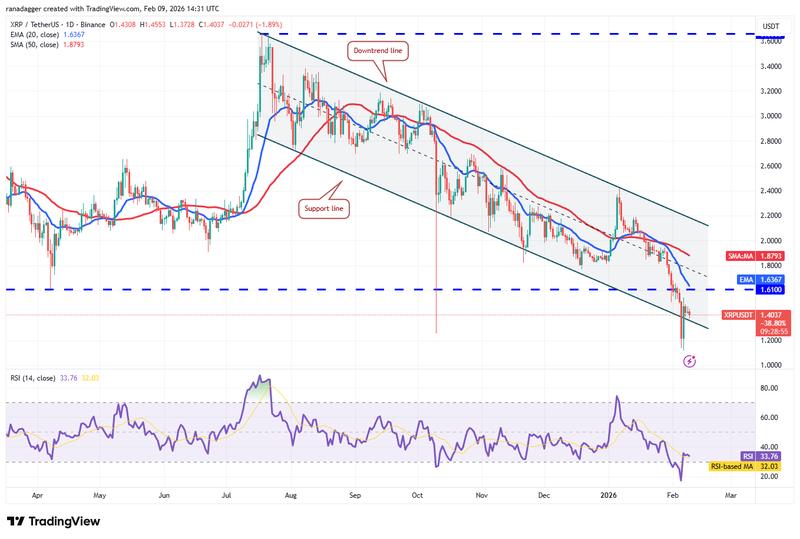
If the price reverses downward and breaches below the support line, this would indicate bears continue to control the market. The XRP/USDT pair could then retest the $1.11 level. Buyers are anticipated to vigorously defend the $1.11 level, as a breakdown below it might send the pair to $1 and subsequently to $0.75.
Buyers must drive the XRP price above the 20-day EMA to secure the short-term advantage. The pair could then advance toward the downtrend line. A close above the downtrend line would signal the beginning of a fresh upward movement.
Solana price prediction
Solana's (SOL) recovery attempt is encountering selling pressure just beneath the breakdown level of $95, suggesting bears are working to transform this level into resistance.
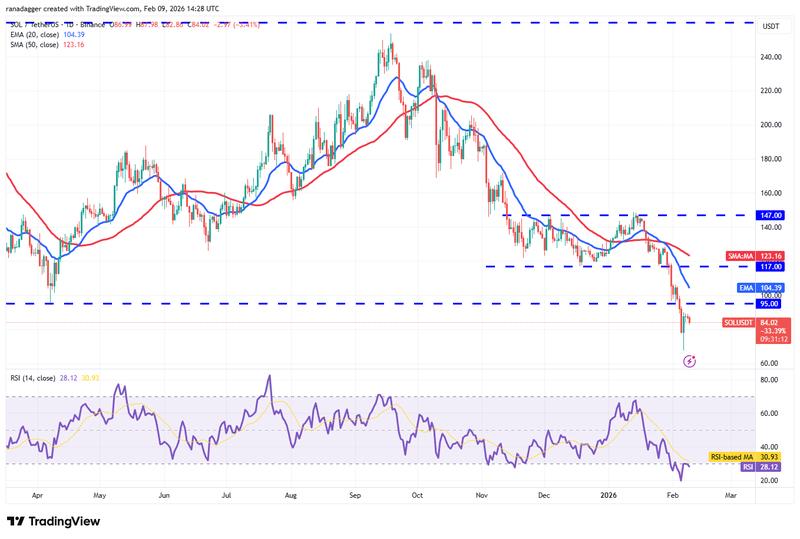
If the Solana price continues its descent and breaks beneath $77, this would indicate bears maintain control of the market. The SOL/USDT pair could then retest the $67 level, which is expected to function as strong support.
Sellers are anticipated to defend the zone between the 20-day EMA ($104) and the $95 level, as a close above this area would signal bulls have reclaimed the driver's seat. The pair could then advance toward the 50-day SMA ($123).
Dogecoin price prediction
Sellers are working to stop Dogecoin's (DOGE) recovery attempt at the psychological level of $0.10.
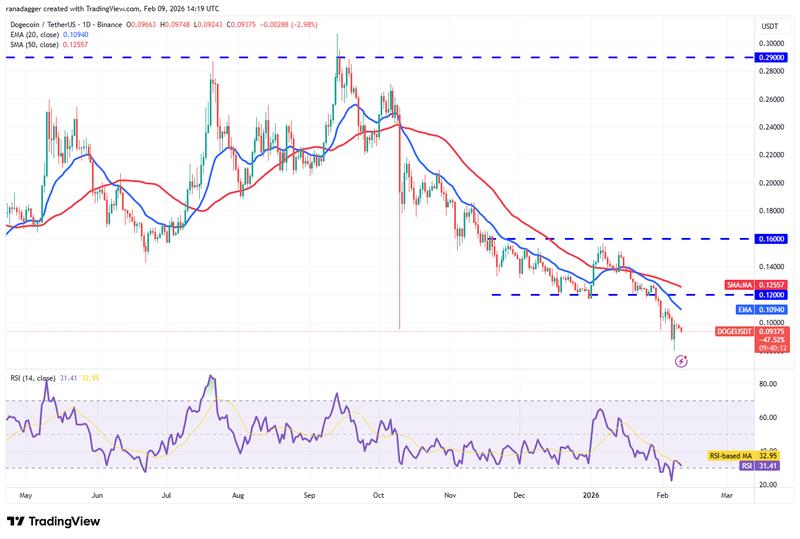
If the Dogecoin price reverses downward from current levels, this raises the likelihood of a breakdown below the $0.08 level. The DOGE/USDT pair could then continue its downward trend and plunge to $0.06.
The window of opportunity is narrowing for bulls. They must drive the price above the 20-day EMA ($0.11) to indicate weakening bearish momentum. The pair could then advance toward the $0.13 level.
Cardano price prediction
Cardano's (ADA) weak rebound from the support line of the descending channel pattern suggests bears are actively selling during upward movements.
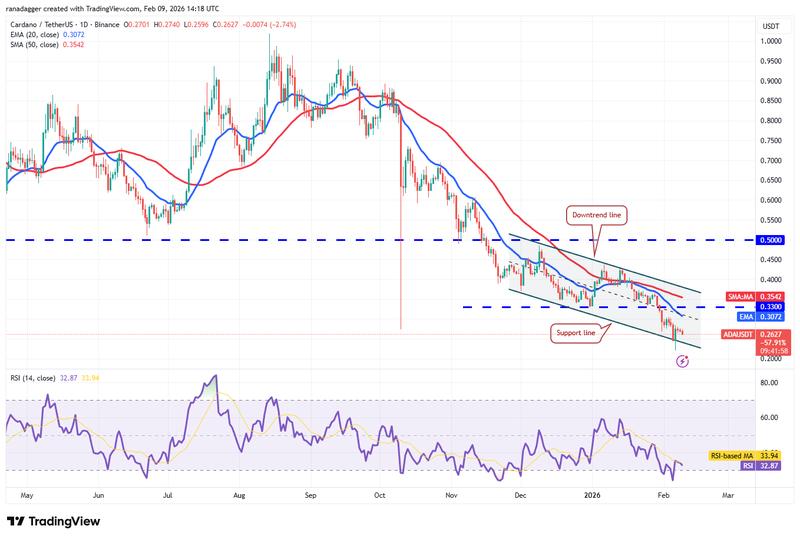
If the Cardano price reverses downward from current levels, bears will make another attempt to drag the ADA/USDT pair below the support line. Success in this effort could result in the pair collapsing to the next support at $0.20.
Alternatively, a breakthrough above the 20-day EMA ($0.30) would indicate the pair may continue trading within the channel for an extended period. Buyers will secure the upper hand with a close above the downtrend line. The pair could then climb to the breakdown level of $0.50.
Bitcoin Cash price prediction
Bitcoin Cash's (BCH) recovery attempt is meeting resistance at the 20-day EMA ($543), reflecting bearish market sentiment.
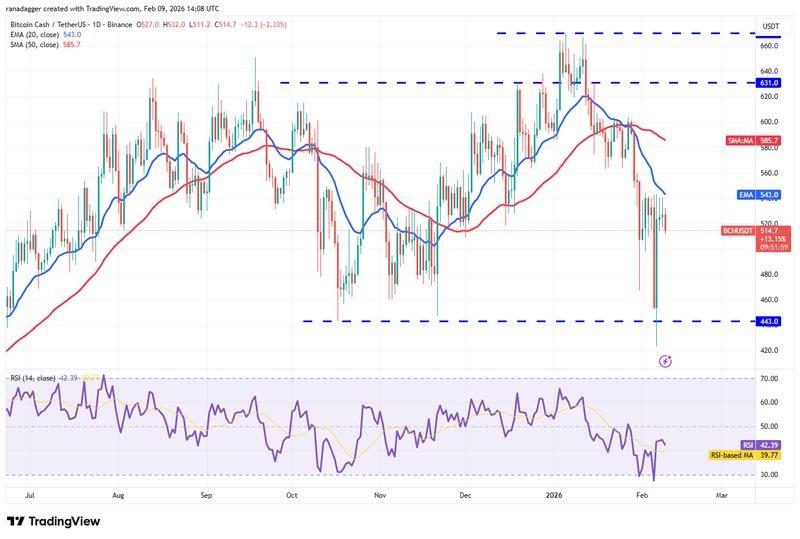
If the price continues its downward movement and breaches below $497, this would indicate bears remain in control. The BCH/USDT pair could then decline toward the critical support at $443, where buyers are expected to provide defense.
On the bullish side, buyers must push and sustain the price above the 20-day EMA to invalidate the bearish outlook. Achievement of this goal could enable the Bitcoin Cash price to climb to the 50-day SMA ($585).