
Is the Bitcoin Bear Market Continuing? Analyst Predicts Genuine Low at $50K
Bearish Bitcoin price forecasts persist as analysts project additional macro downturns, drawing parallels to the 2022 cryptocurrency bear market cycle.

Despite Bitcoin (BTC) climbing as much as 3% on Sunday, certain market analysts remain unconvinced that the recent BTC price decline has reached its conclusion.
Key points:
- Historical Bitcoin price patterns suggest additional macro lows may be forthcoming if parallels to the 2022 bear market persist.
- Technical indicators including moving averages and US spot Bitcoin ETF cost basis levels are drawing significant attention.
- Experts note that an exact replication of the 2022 scenario remains uncertain.
Final Bitcoin capitulation "hasn't happened yet"
According to data sourced from TradingView, BTC/USD surpassed the $71,000 mark, representing a 20% increase from Friday's lowest levels seen in 15 months.
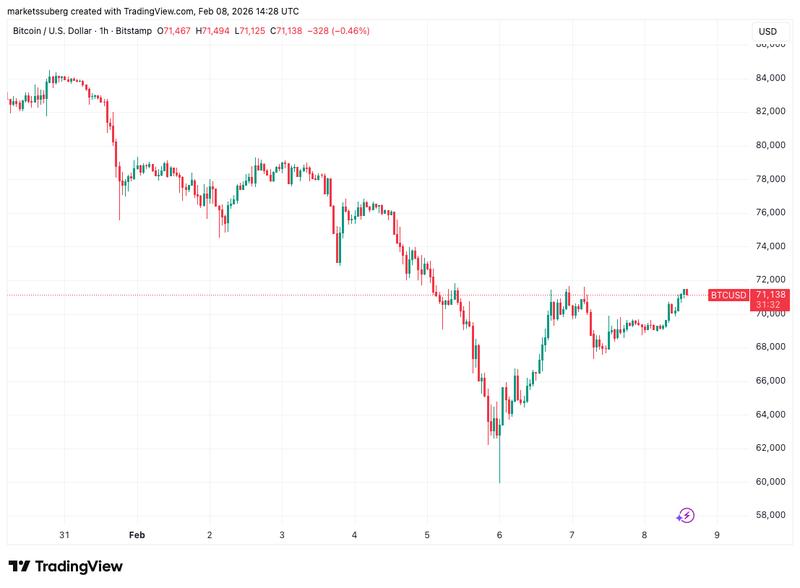
With the weekly close approaching, Bitcoin exhibited its typical volatility patterns, though market observers maintained a highly doubtful stance regarding the sustainability of this upward movement.
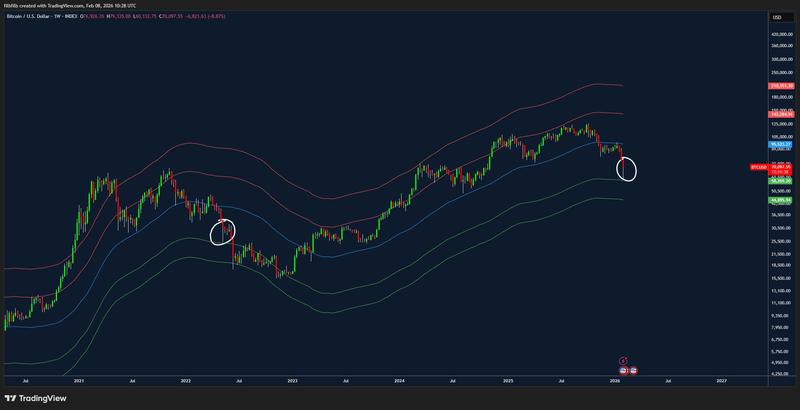
Independent market analyst Filbfilb shared a comparison chart on X platform, juxtaposing present-day BTC price movements with those observed during the 2022 bear market period, delivering unfavorable projections for bullish investors.
"Im not going to try to dress it up any way other than how it looks," he commented alongside a chart showing spot price versus the 50-week exponential moving average (EMA) at $95,300.
Market analyst Tony Severino expressed comparable viewpoints, presenting numerous price metrics and determining that additional downward price action appeared nearly inevitable.
"$BTC final capitulation hasn't happened yet," trader BitBull agreed, like Filbfilb referencing 2022.
"A real bottom will form below $50,000 level where most of the ETF buyers will be underwater."
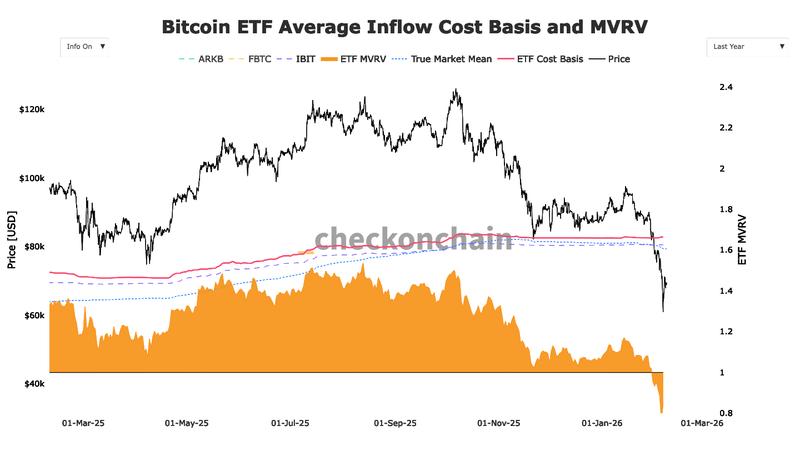
According to information from monitoring resource Checkonchain, the US spot Bitcoin exchange-traded funds (ETFs) presently maintain an average purchase price of $82,000.
Historical BTC price patterns emerge again
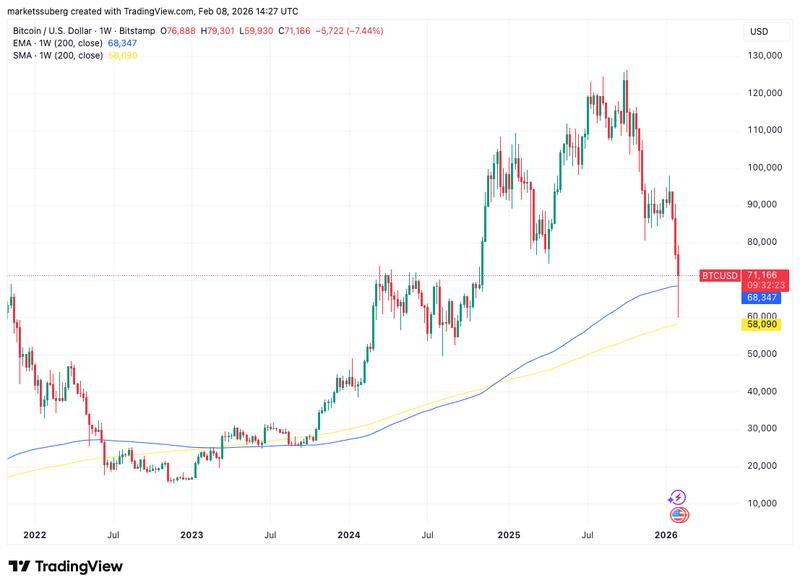
Previously, Cointelegraph published reports examining a significant bear market characteristic for Bitcoin utilizing two additional trend indicators: the 200-week simple (SMA) and exponential moving averages.
Combined, these indicators create a support "cloud" spanning from $58,000 to $68,000.
In a recent weekend market analysis, Caleb Franzen, founder of analytics resource Cubic Analytics, contended that in this case as well, historical patterns from 2022 were manifesting once again.
"In May 2022, Bitcoin retested its 200-week MA cloud. Bulls said 'that's it, we've retested the long-term moving average & can continue higher now.' Price immediately rebounded on that zone, produced a long wick, & closed above the midpoint of the weekly range," he summarized.
"But then that rally faded... Price came back into the 200W MA cloud a few weeks later, failed to rebound, then sliced through the cloud in June 2022. What are we seeing right now? The first retest of the 200W MA cloud with a long wick."
Franzen highlighted that current market conditions may not mirror the earlier bear market cycle "perfectly."
"The reality is that no one knows what happens next," he acknowledged.