
Is Solana Severely Undervalued? Three Key Metrics Show Strong Fundamentals
While Solana struggles to reclaim the $100 threshold, its climbing 30-day decentralized exchange volumes and consistent spot ETF capital flows suggest underlying strength. Does this indicate SOL is trading at attractive valuations?
The price of Solana's native token SOL (SOL) has declined 72% from its record peak of $295 and remains significantly beneath the $188 price point observed when its spot exchange-traded funds (ETFs) debuted in October 2025. Throughout a period beginning in early December 2025, capital inflows to spot SOL ETF products have moderated while the token's value experienced a substantial four-month correction.
Concurrently, onchain transaction volumes and revenue generation metrics for the Solana network continue to outperform rival blockchain platforms, prompting questions about whether SOL's extended-term price trajectory favors an eventual recovery to its previous all-time high.
Network utilization supports SOL ETF stability
The launch of spot SOL ETFs occurred in late October 2025, attracting more than $100 million in average net capital inflows throughout their initial five-week period. Starting from December 2025, these weekly inflow figures have moderated, settling at an average range of $20 million to $25 million even as SOL's price descended to $86 during February 2026.
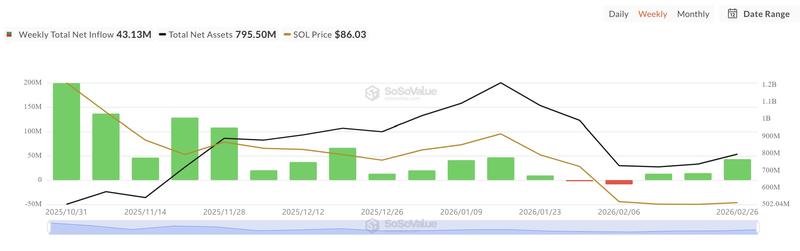
Throughout the entire four-month price decline, aggregate capital outflows amount to merely $11.3 million spread across two weeks. In contrast, spot Bitcoin (BTC) and Ether (ETH) ETF products have registered four straight months of net negative capital flows during this identical timeframe.
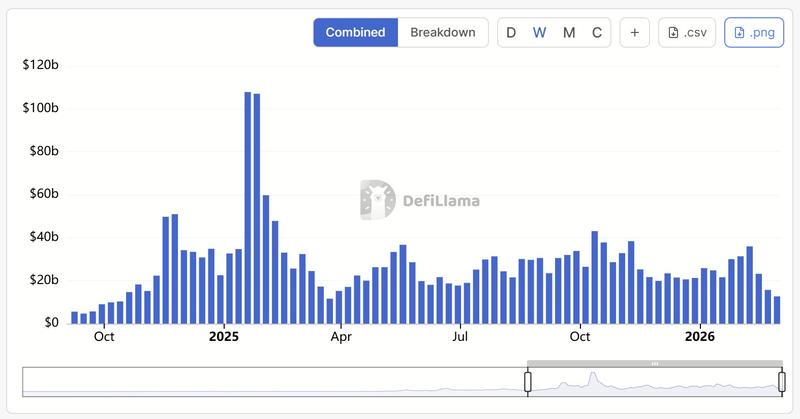
The operational activity across Solana's network paints a contrasting picture compared to its price performance. During the most recent 30-day window, Solana facilitated $108 billion in decentralized exchange (DEX) transaction volume, surpassing Ethereum's $63.7 billion and Base's $31.48 billion. Transaction volumes during January climbed to $117 billion, outpacing the figures recorded in both December and November for the blockchain network. Weekly volume averages from January 2025 onward have remained in the vicinity of $20 billion to $25 billion.
Within the preceding 24-hour period, Solana produced $3.1 million in application revenue compared to Ethereum's $2.95 million. The count of active addresses measured 2.17 million versus 682,236, while network fees totaled $722,706 in comparison to Ethereum's $356,438.
The real-world asset (RWA) sector on Solana has additionally achieved a fresh all-time high of $1.71 billion, representing a 45% increase over 30 days, though Ether maintains $15 billion of the $25.37 billion total distributed asset value within this particular industry segment.
Critical support levels and valuation discrepancy
Cryptocurrency analyst Scient identified two significant macro zones that could potentially establish a price floor. The initial area encompasses the 0.75 Fibonacci retracement region spanning $60 to $70, a price range typically correlated with more pronounced corrections occurring within broader bullish trends.
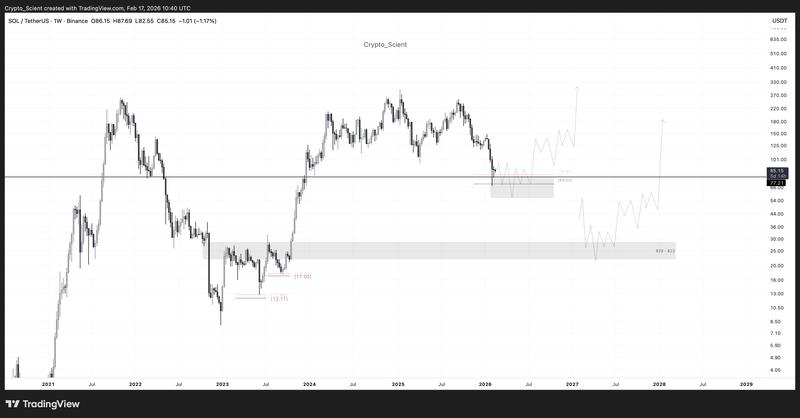
The secondary zone represents a weekly demand fair value gap (FVG) spanning $22 to $29, representing a region of previous liquidity imbalance that came before the remarkable price surge from $25 to $200.
At present, the technical structure continues to face limitations as the price remains beneath the weekly resistance threshold of $120.
Examining the weekly chart reveals that SOL has already probed the demand zone ranging from $51 to $80, corresponding with that retracement area, and could potentially initiate a recovery trajectory from its present valuation.
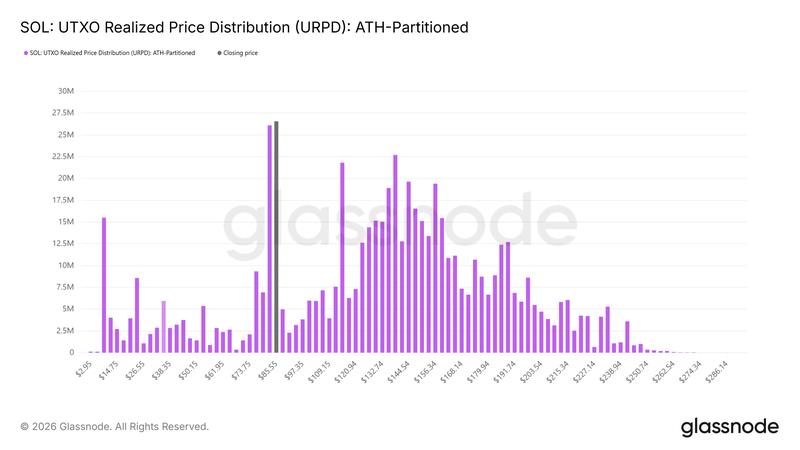
Analysis of UTXO Realized Price Distribution (URPD) metrics provides additional perspective. More than 6% of the total supply last experienced movement within the present price cluster, establishing a concentrated cost basis region. The subsequent major concentration, exceeding 3% of total supply, resides between $20 and $30.
Examining valuation metrics, SOL currently trades near a realized supply concentration point, while ETF investor positioning has remained intact, and DEX transaction throughput continues to exceed competing blockchain networks despite Solana's comparatively lower total locked value (TVL).
The price consolidation occurring simultaneously with steady capital inflows and expanding network utilization exposes a quantifiable divergence between operational activity and market valuation.
The resolution of this divergence through SOL's future price movements will ultimately depend on how the $51 to $80 support level and the $120 resistance threshold interact with these fundamental factors throughout the upcoming months.