
ETH Whales Step Back During Extended Slump Not Seen Since 2022: Price Outlook
Large Ether holders reduce position sizes as nearly $2 billion in short positions accumulate around the $2,000 level, creating a liquidity squeeze for ETH following its sixth consecutive week of declining prices.
Major exchange activity from Ether (ETH) whales has experienced a notable deceleration since the beginning of 2026, with approximately 2 million ETH changing hands through large-volume transactions throughout the last 45 days.
The second-largest cryptocurrency by market capitalization is presently experiencing its most prolonged sequence of weekly declines since 2022, as patterns in exchange flows and liquidation metrics from the futures marketplace shape trader sentiment regarding both near-term and extended price trajectories across the wider cryptocurrency ecosystem.
Declining Ether whale transaction volumes signal reduced engagement
According to analytics from CryptoQuant, the mean size of ETH whale sell orders executed on Binance has decreased to approximately 1,350 ETH in the latest weeks, representing a decline from about 2,250 ETH recorded during the opening days of January. When accounting for an estimated 15 to 35 whale-tier transactions occurring daily, the aggregate gross volume on the sell side since Jan. 8 reaches an estimated range between 1.8 million and 2 million ETH throughout the 45-day period.
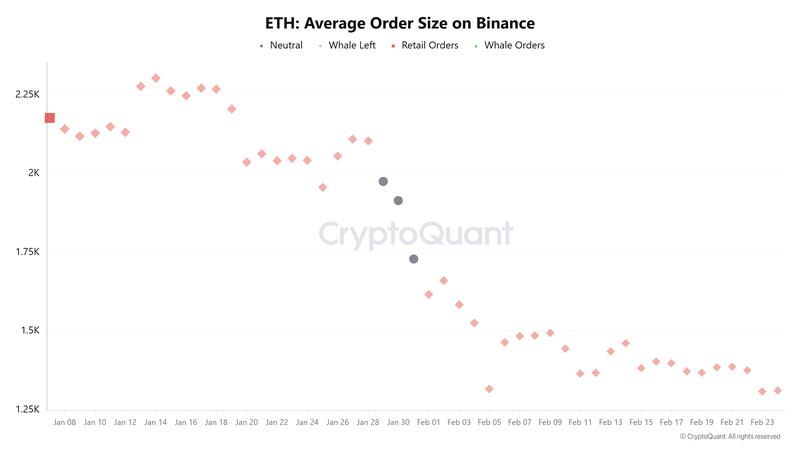
When calculated at a mean trading price of $2,400, this trading activity translates to approximately $4.3 billion through $4.8 billion in whale-tier order executions. This number represents gross volume traded rather than verified net withdrawals, given that a portion of these flows could be connected to hedging strategies or the provision of liquidity in derivative trading environments.
Cryptocurrency market analyst Darkfost characterized the reduction in mean order sizes as evidence of a "gradual disengagement" among larger market participants. The analyst noted that while smaller-scale traders maintain consistent transaction volumes, institutional-sized players appear to be scaling back their direct engagement with exchange order books.
This transformation suggests a provisional reduction in available market depth. As the number of substantial resting orders diminishes, ETH's ability to handle significant price disparities becomes more limited over the immediate term.
Coinciding with these exchange flow patterns, ETH accumulation wallets incorporated over 2.5 million ETH during February even as prices declined roughly 20%. Aggregate holdings increased to 26.7 million ETH from 22 million recorded at the beginning of 2026, demonstrating persistent underlying buying interest.
Can Ether reverse its most extended bearish run since 2022?
Ether has now registered six consecutive weeks of negative returns, representing the most extended unbroken weekly depreciation since the 10-week downtrend spanning March 2022 through June 2022. That previous extended decline occurred amid a comprehensive bear market phase and ultimately resulted in a cyclical price floor before conditions stabilized.
Despite the current retracement being shorter in duration, the consecutive weekly losses underscore persistent distribution pressure and deteriorating bullish momentum across longer timeframe charts.
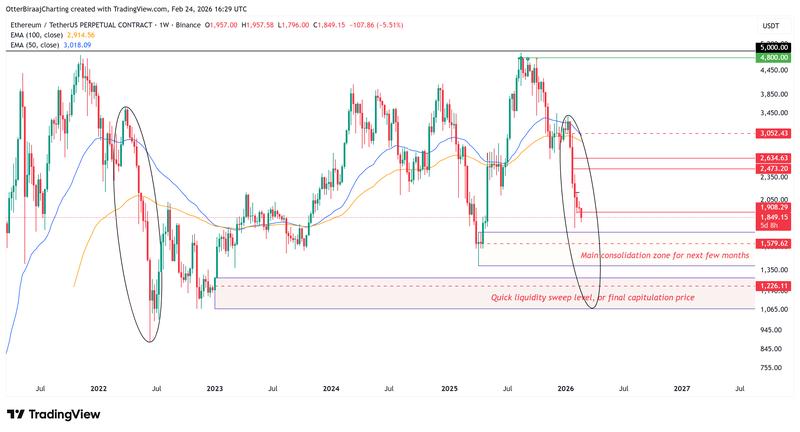
Analysis of historical market cycle patterns indicates that should the downward movement persist, a substantial weekly support corridor ranging from $1,384 through $1,691 could emerge as a focal point, representing a zone that functioned as an accumulation region during the initial phase of the 2023 bullish rally.
Liquidation metrics from the futures marketplace reveal in excess of $2 billion worth of short positions concentrated in proximity to $2,000. This concentration establishes a substantial liquidity cluster that could function as the immediate-term price target for Ether.
Conversely, around $682 million in long positions face liquidation risk should Ether experience a decline toward $1,600, suggesting reduced liquidity availability relative to the upside concentration.
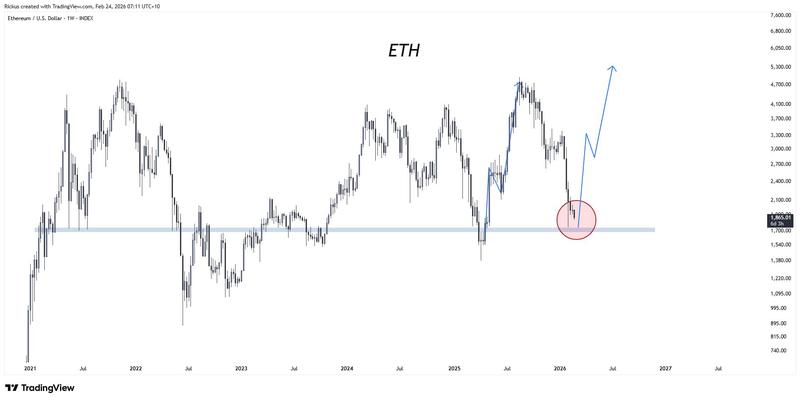
Cryptocurrency trader RickUntZ stated that he continues to identify the possibility of a V-shaped recovery pattern from present price levels, pointing to indications of fundamental demand within the existing market structure. At this time, market data indicates that the $2,000 liquidation concentration zone represents the immediate critical resistance level requiring penetration.
This article does not contain investment advice or recommendations. Every investment and trading move involves risk, and readers should conduct their own research when making a decision. While we strive to provide accurate and timely information, Cointelegraph does not guarantee the accuracy, completeness, or reliability of any information in this article. This article may contain forward-looking statements that are subject to risks and uncertainties. Cointelegraph will not be liable for any loss or damage arising from your reliance on this information.