Data Suggests Ether Could Climb to $2,500 When Critical Technical Factors Align
Despite a 20% February decline, Ether shows promise with an emerging bullish pattern under $2,000 and increasing liquidation levels pointing toward potential recovery.
The week began with Ether (ETH) sliding beneath the key $2,000 psychological threshold, pushing the cryptocurrency to a 20% decline throughout February. However, blockchain data reveals that long-term holders continue accumulating ETH while network activity shows signs of growth.
Market observers are now analyzing whether ETH's chart formations and futures market indicators complement the growing buyer interest to assess the likelihood of a sustained move back above $2,000.
Key takeaways:
- Accumulation addresses absorbed more than 2.5 million ETH during February, pushing total holdings to 26.7 million for 2026.
- Weekly Ethereum transactions reached 17.3 million while median transaction fees dropped to $0.008, representing a 3,000x decrease from 2021 highs.
- Open interest in ETH declined to $11.2 billion, though leverage levels stay high, with significant liquidation zones positioned around $1,909 and $2,200.
Accumulation activity intensifies amid price weakness
Throughout February, accumulation-focused addresses have absorbed in excess of 2.5 million ETH, despite prices falling approximately 20%. Combined holdings have climbed to 26.7 million ETH, representing an increase from the 22 million recorded at 2026's start.
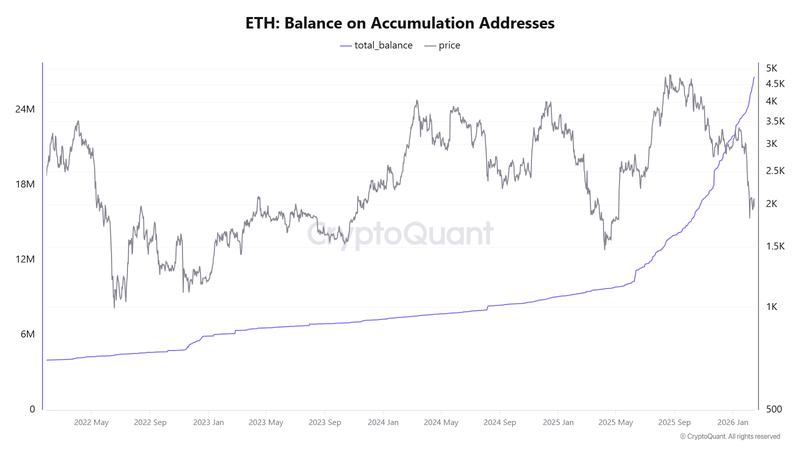
According to Michaël van de Poppe, founder of MN Capital, Ether's value relative to silver has reached historic lows, suggesting that challenging market conditions like these frequently create favorable entry points for long-term positioning.
Network utilization metrics are strengthening in tandem with improving underlying fundamentals. Currently, over 30% of ETH's available supply (37,228,911 ETH) remains locked in staking contracts, constraining liquid availability. Concurrently, the weekly transaction volume hit an unprecedented 17.3 million, even as median transaction costs plummeted to $0.008.
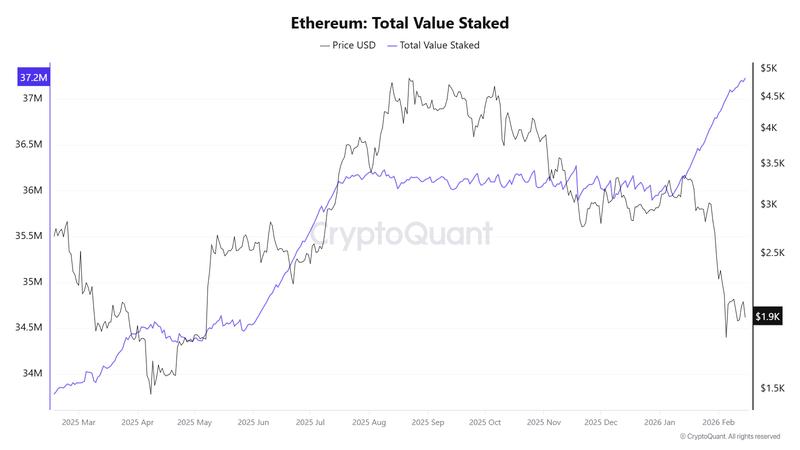
By comparison, Leon Waidmann, head of research at Lisk, highlighted that weekly transaction volumes approached 21 million during 2021's bull market, though median fees at that time exceeded $25. Today's dynamics demonstrate substantially greater network usage accompanied by dramatically reduced transaction expenses.
Ether consolidates beneath $2,000 while leveraged positions await directional move
Technical analysis of the four-hour timeframe suggests Ether may be developing an Adam and Eve bottom pattern, a constructive reversal formation characterized by an initial sharp, V-shaped trough (representing "Adam") succeeded by a more gradual, rounded foundation (the "Eve" component).
This configuration indicates an initial forceful downturn that rapidly attracts purchasing interest, followed by an extended phase of methodical accumulation as price volatility diminishes.
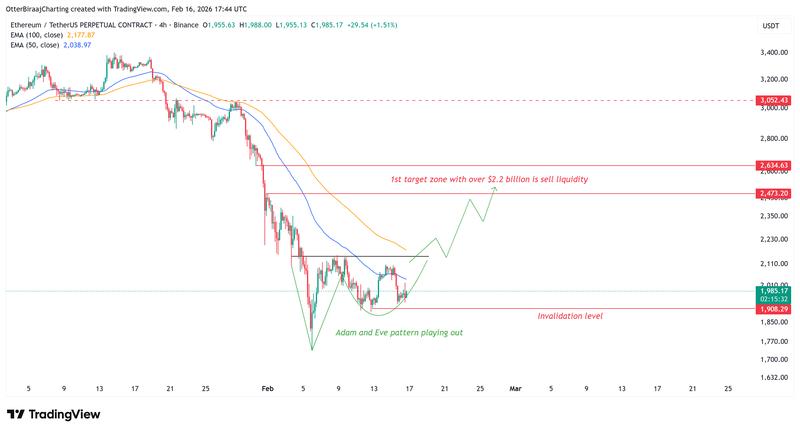
Should price action confirm a decisive move above the $2,150 neckline resistance, the pattern becomes validated and could potentially unlock upside momentum toward the $2,473–$2,634 target zone, calculated through the measured move methodology applied to the formation's base. Pattern negation would occur beneath recent swing lows, with $1,909 serving as a critical near-term support and liquidity zone.
Total open interest has contracted to $11.2 billion compared to the $30 billion cycle maximum recorded in August 2025. Nevertheless, the calculated leverage ratio persists at elevated levels of 0.7, declining only marginally from January's 0.77 reading. This data indicates that substantial leverage remains embedded within market positioning, amplifying the probability of volatile price swings.
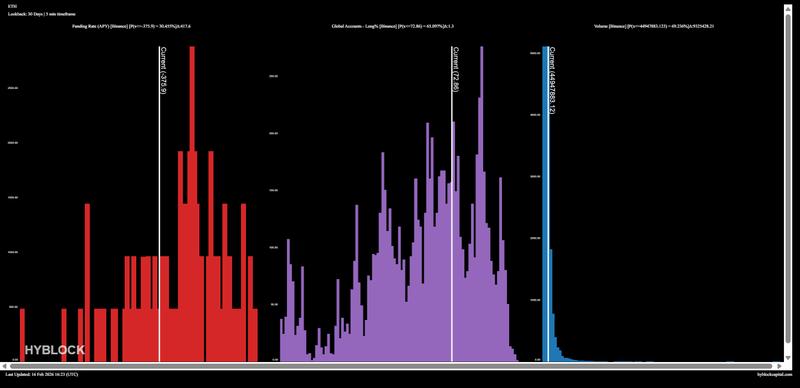
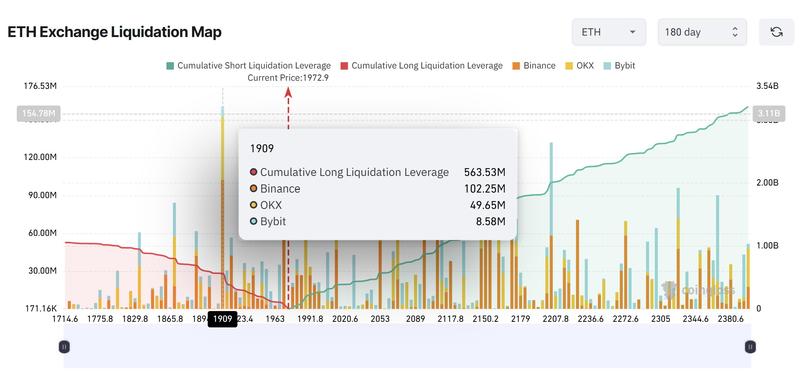
According to Hyblock analytics, 73% of worldwide trading accounts maintain long exposure to ETH. Liquidation mapping reveals in excess of $2 billion worth of short positions concentrated above the $2,200 price level, contrasted with approximately $1 billion in long liquidations positioned near $1,800, underscoring asymmetric squeeze potential favoring upward movement.
The most immediate high-density liquidation cluster exists at $1,909, where approximately $563 million in long positions face liquidation risk, potentially functioning as a temporary downside liquidity target preceding any anticipated bullish reversal.