
Critical Bitcoin Price Targets Emerge as BTC Approaches Fresh Monthly Peaks
BTC is positioned for its most robust weekly performance since reaching new all-time highs in 2025. Market experts identify crucial price thresholds that Bitcoin must reclaim to maintain its ongoing upward trajectory.

The price of Bitcoin (BTC) surged toward a monthly peak near the $74,000 mark, recording a 10.42% gain over the past seven days, representing its most impressive weekly performance since September 2025.
Activity across spot markets, inflows into exchange-traded funds (ETFs), and Bitcoin accumulation at the corporate level indicate a favorable demand shift, while market observers track whether this renewed buying momentum can drive prices toward elevated targets.
Coinbase premium gap turns positive following 10-week streak
According to crypto analyst IT Tech, the Coinbase premium gap—a metric that tracks the price differential between Bitcoin on Coinbase compared to international exchanges—currently stands at +35.4, representing the first time it has entered positive territory in approximately ten weeks.
This indicator had previously plummeted to –175 on Feb. 2, during a period when Bitcoin was trading around $78,000. That moment represented the most severe negative reading throughout the correction phase that drove BTC down toward the $60,000 level.
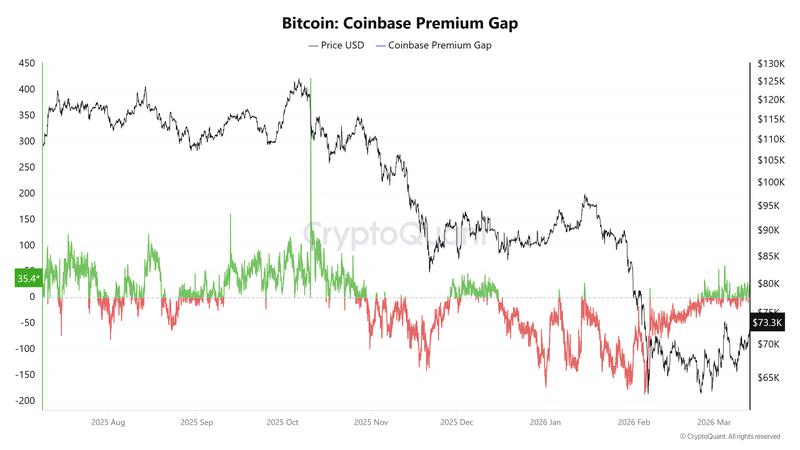
Throughout the majority of 2026, the premium indicator has stayed in negative territory, demonstrating continued selling activity from traders based in the United States. When the premium turns positive, it indicates buying pressure, which has aligned with Bitcoin's current price rally.
Inflows into spot BTC ETF products have similarly shown improvement during the last three weeks. Net inflows have now surpassed $1.9 billion, aligning with the recent price recovery and increasing participation from institutional investors.
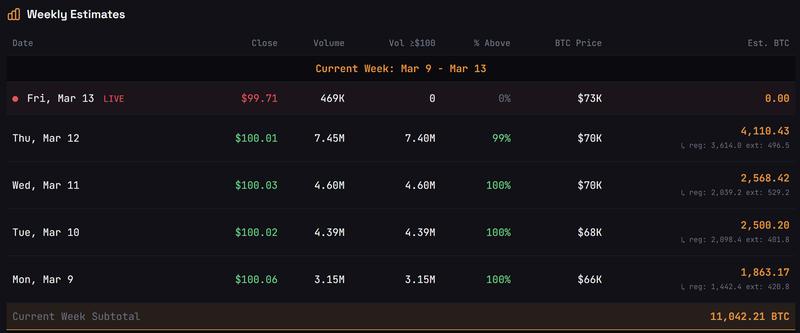
Corporate purchasing activity has contributed additional demand. Strategy purchased 11,042 BTC during the current week via its STRC financing program, contributing to the consistent buying support that has underpinned Bitcoin's dramatic rise since Monday.
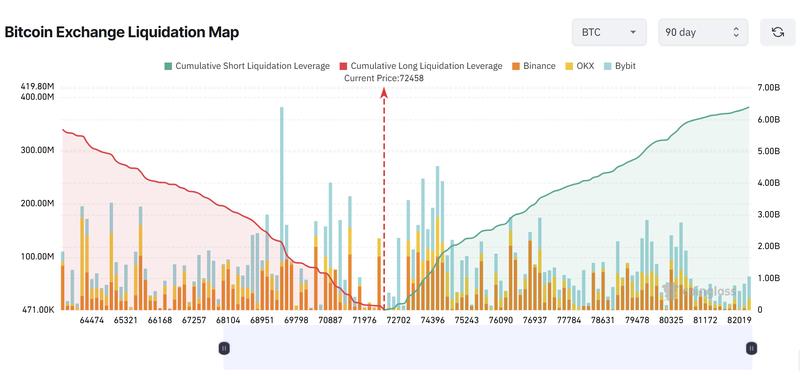
Major BTC liquidity zones positioned above $75,000
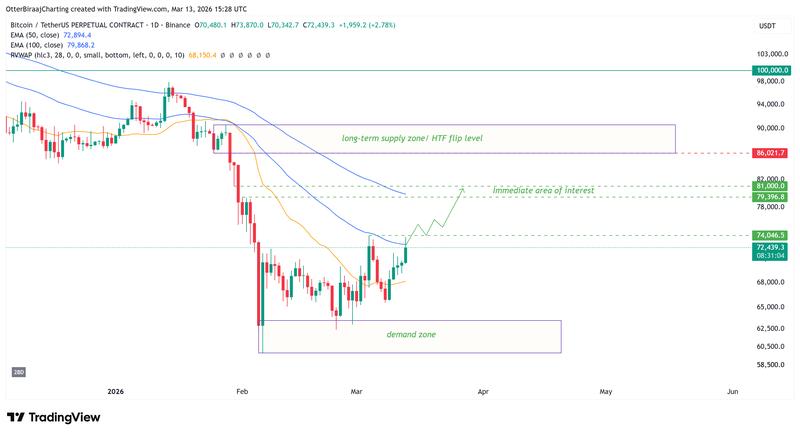
At present, Bitcoin is working to recapture its 100-day moving average on the daily timeframe, representing the first significant challenge of this level since it transitioned into a resistance point on Jan. 20.
Should Bitcoin maintain stability above the $74,000 threshold, the asset moves back into an area characterized by concentrated liquidity. Data from the liquidation map indicates approximately $1.9 billion worth of leveraged long positions accumulated just beyond $75,000, which may draw price action higher as BTC pursues zones with greater liquidity.
Beyond the $75,000 mark, close to $2 billion in sell-side liquidity exists between $76,000 and $80,000, though this liquidity is spread across a $4,000 price range.
Should BTC break through this area, the subsequent nearby technical zone lies between $79,400 and $81,400, where a one-hour fair value gap (FVG) developed during the prior downward movement. These imbalances that emerge between buying and selling forces frequently serve as critical inflection points for trend continuation.
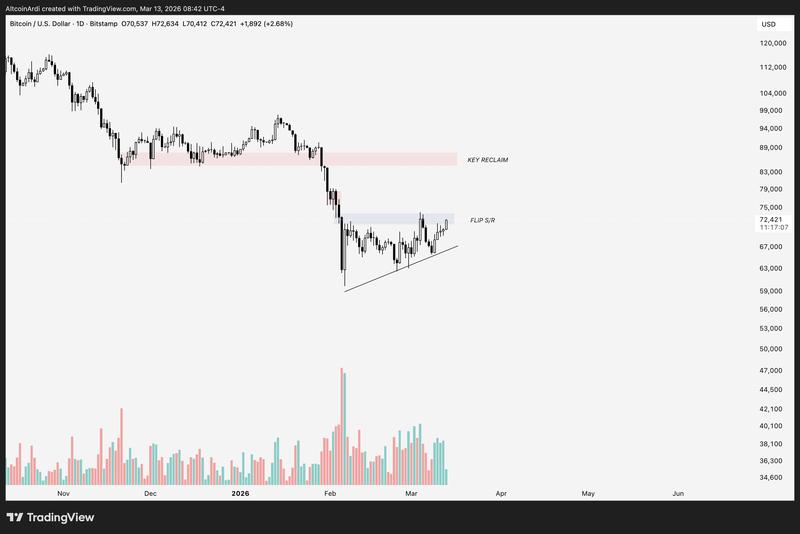
Commenting on the possible retest of the $74,000 level, crypto trader Ardi stated that Bitcoin must convert this price point into support and recapture the $85,000 area to reconstruct a higher-time frame (HTF) bullish trajectory.
Concurrently, Michaël van de Poppe, founder of MN Capital, pinpointed $76,000–$79,000 as a resistance zone where increased momentum could potentially overflow into alternative cryptocurrency markets.
A push into this price region would create a monthly engulfing candle formation, essentially reversing February's price correction for BTC. When a bullish engulfing pattern appears on the monthly timeframe, it may attract heightened buying interest from market participants, as it represents a favorable shift on a higher-time frame (HTF) chart.