
BTC Market Watches Iranian Response While Oil Prices Drive 5% U.S. Inflation Predictions
BTC maintained stability despite significant geopolitical turbulence in the Middle East, as analysts now project potential price movements toward $74,000.

On Sunday, Bitcoin (BTC) remained resilient amid geopolitical turbulence while market participants awaited reactions from Iran-related developments.
Key points:
- Bitcoin maintains position near $67,000 following an eventful weekend of Middle Eastern developments.
- Traditional finance market responses remain central to attention, while BTC demonstrates relative price stability.
- Growing oil market anxieties intensify as Iran moves toward closing the Strait of Hormuz.
Market Analyst Projects BTC Rally to $74,000
According to data from TradingView, BTC's price activity concentrated around the $67,000 level following the most recent escalation of tensions in the Middle East region.
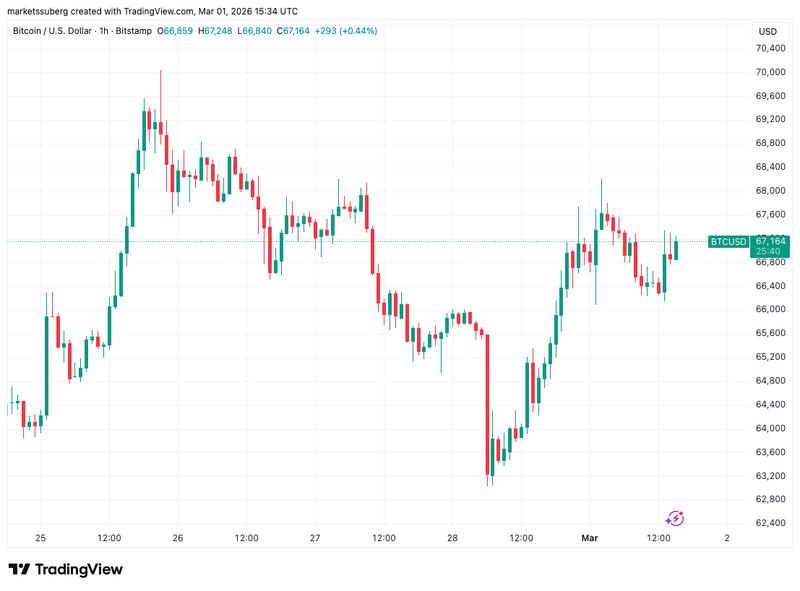
Traditional finance markets were unable to respond to developments in real time due to the weekend timing, with US stock market futures trading lower by 0.65% as of press time.
Cryptocurrency markets experienced volatility as well, though conditions stabilized relatively quickly, and BTC/USD remained within its established local trading parameters without a significant breakout.
Providing commentary, Michaël van de Poppe, a crypto trader, analyst and entrepreneur, characterized the initial market response as showing "positive" signs.
"Now, markets are correcting back down, as there's uncertainty on how US markets will open tomorrow (and there's still an outstanding gap of the CME)," he wrote in a post on X.
"On the other hand, the 21-Day MA needs to break in order to have a relief rally. I think we'll see it in March/April, question of how we're opening the markets tomorrow and whether it finds a higher low."
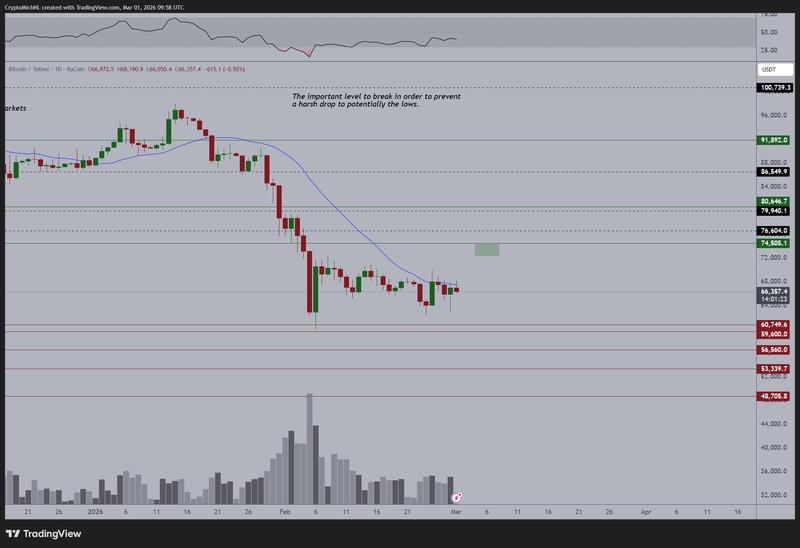
Van de Poppe's analysis highlighted Bitcoin's 21-day simple moving average positioned at $67,627. The CME Group's Bitcoin futures market showed a weekend "gap" positioned on the downside at $65,880.
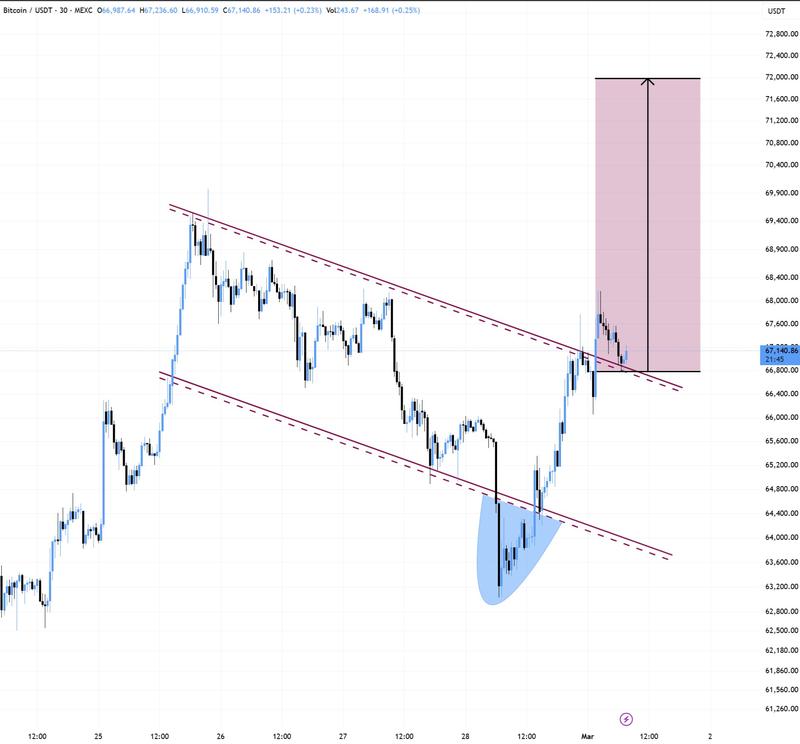
"$BTC looks good in the short-term," trader BitBull stated in agreement regarding the three-day chart analysis.
"Deviation below the support zone and has now flipped resistance into support. I think a rally towards the $73K-$74K level could happen."
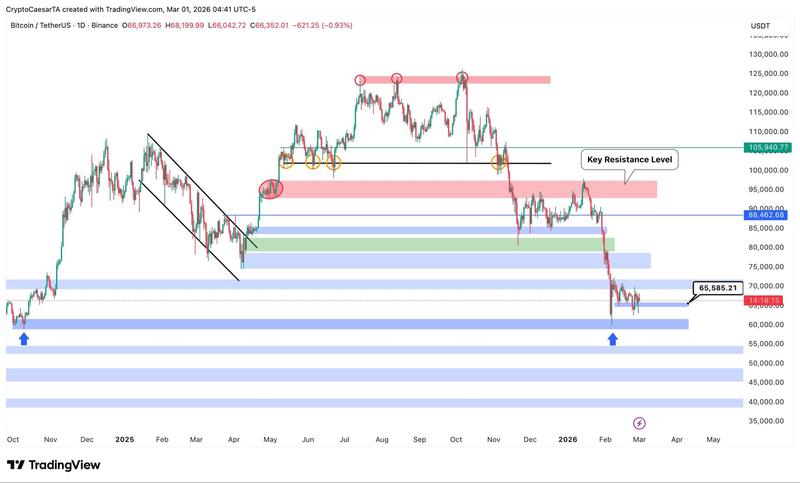
Certain market observers suggested that the geopolitical uncertainty had already been factored into prices ahead of time, which would account for the relatively muted weekend price movements.
"We will probably move side ways the next days…," trader Crypto Caesar concluded.
Hormuz Strait Closure Linked to Coming U.S. Inflation Surge
An additional area of concern centered on possible oil market volatility as Iran announced intentions to close the Strait of Hormuz.
Although classified as international waters, the Strait became a containment area for oil transportation vessels on Sunday, prompting immediate analysis of potential ramifications for United States inflation metrics.
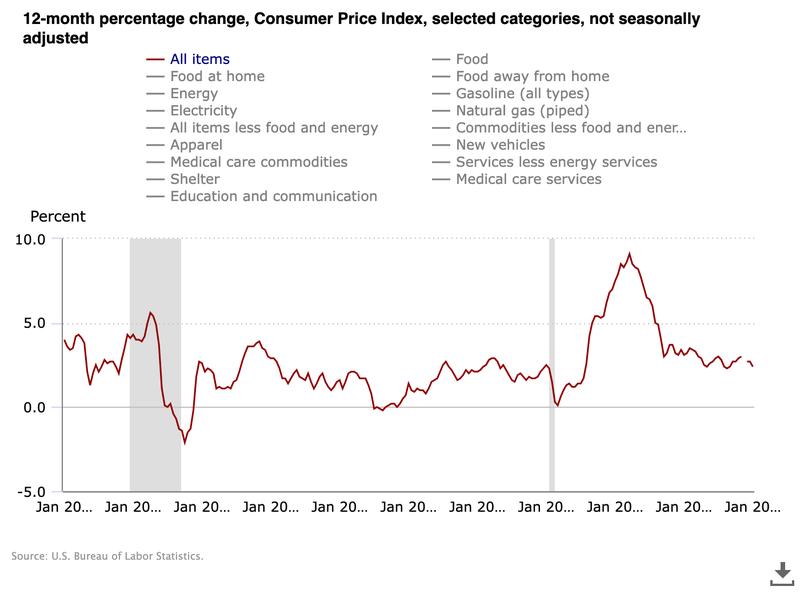
The Kobeissi Letter, a trading resource platform, cited JPMorgan research while projecting that the Consumer Price Index (CPI) might surge to 5%.
"The last time we saw US inflation at 5% was in March 2023, when the Fed was aggressively hiking rates," it wrote in a dedicated X thread.
According to Cointelegraph's previous coverage, the latest US inflation data exceeded market expectations, particularly Friday's Producer Price Index (PPI) figures.