
Bitcoin's Pivotal Week: Will BTC Surge to $75K or Enter Bearish Territory?
Market participants anticipate a potential short squeeze pushing Bitcoin toward $75,000, though onchain metrics suggest a possible bearish "regime shift" could be underway.
As a fresh week begins, Bitcoin (BTC) finds itself positioned at a critical juncture, with market analysis indicating the possibility of another short squeeze developing.
- BTC concluded the previous week trading above a crucial 200-week trend line, sparking renewed optimism for a potential move toward $75,000.
- Liquidation volumes remain high, with one market observer pointing out that long position holders should now have the advantage moving forward.
- A series of US inflation reports are scheduled for release, with the potential for risk-asset volatility concentrated in the latter part of the week.
- Onchain profitability metrics for Bitcoin present a concerning scenario, as the net unrealized profit and loss ratio reaches levels not seen in three years.
- Data from UTXOs in loss territory indicates Bitcoin could be entering the initial stages of a fresh bear market cycle.
Bitcoin confronts 2024 trading range amid "substantial uncertainty"
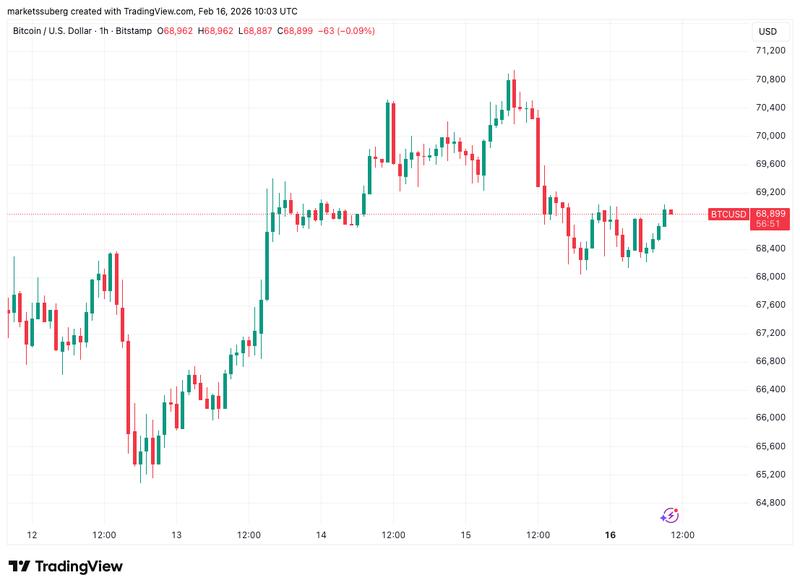
The weekly candle for Bitcoin closed Sunday with surprisingly little drama, though market participants are well aware of the importance of current price levels.
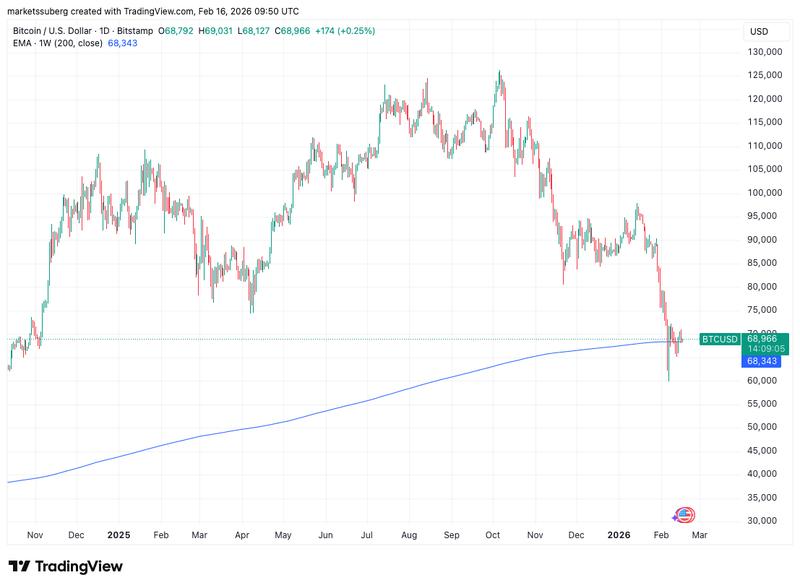
Trading at approximately $68,800 on Bitstamp, according to TradingView data, the weekly close positioned itself above a critical long-term trend line that will prove essential for any future price appreciation.
Presently sitting at $68,343, the 200-week exponential moving average (EMA) represents one of two adjacent lines in the sand for those watching the market. The second is Bitcoin's previous all-time high established in 2021 at slightly above $69,000.
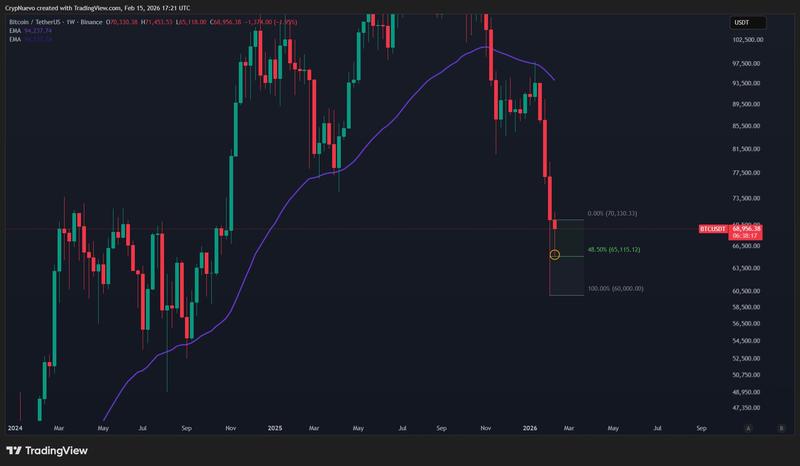
"We're back inside an old important range that kept price for 7 months!" trader CrypNuevo wrote in his latest X analysis.
The analyst referenced the prolonged sideways price action centered on the $69,000 level that characterized BTC/USD throughout 2024.
His observations highlighted that during the previous week, the trading pair recovered nearly half of the wick created during its descent to 15-month lows earlier this February — a development that may hold implications for the broader directional trend.
"So Bitcoin might range here for some time, meaning that price could test the range lows," the analysis continued.
"Only if: 1. Bitcoin drops back to the 50% wick-fill level (signal for 100% wick-fill). 2. Acceptance below 100% wick."
The analyst identified a potential rally to $75,000 as the catalyst that might initiate a "surprise recovery," noting that Bitcoin "tends to do the opposite of the market sentiment."
"A lot of uncertainty for the upcoming week. Also, Monday is bank holiday in the US so expecting irregular volatility (probably low volatility that day)," he concluded.
Cryptocurrency liquidations remain elevated near $70,000 BTC level
Even with the comparatively muted BTC price action following the bounce from $59,000 lows, the market continues to demonstrate heightened sensitivity to relatively modest price movements.
This phenomenon is evident in the sustained high liquidation volumes across the cryptocurrency sector, with both long and short positions in proximity to spot prices being continuously wiped out.
Information from monitoring resource CoinGlass shows the aggregate liquidation figure for the 24-hour period leading up to the time of writing exceeded $250 million. Throughout this interval, BTC/USD moved within a corridor of under $3,000.
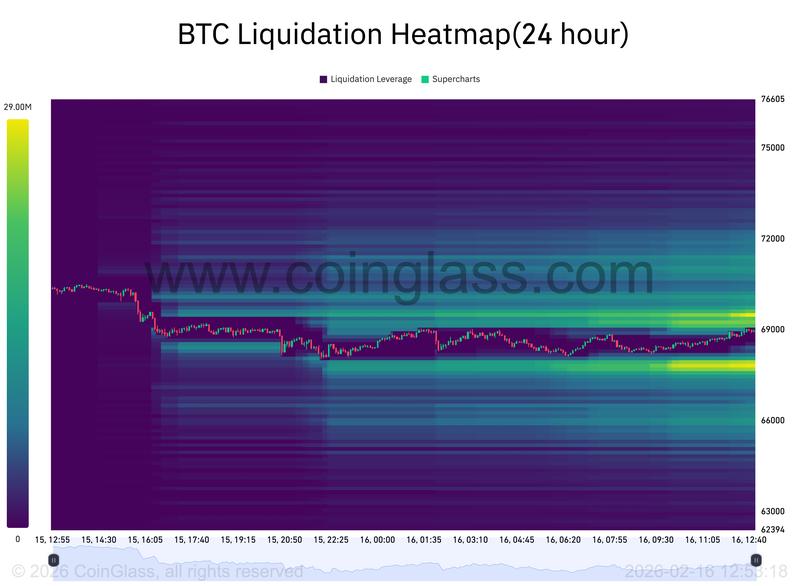
Data from CoinGlass now reveals traders establishing new long BTC positions just beneath the $68,000 threshold as the week commences.
Providing commentary, trader CW indicated that these positions would likely become the next focus for larger market players.
CW offered some potentially encouraging news for those maintaining bullish positions, with longs continuing to hold the advantage in the present market environment.
"Despite significant liquidation of $BTC long positions, longs remain dominant. Expectations for a bullish trend remain intact," they told X followers.
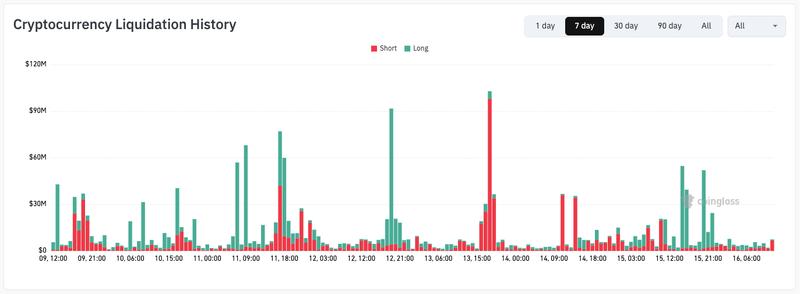
Last Friday, as BTC/USD briefly surged beyond $70,000 coinciding with Wall Street's opening bell, short liquidations actually surpassed recent historical highs. With 10,700 BTC liquidated, the short liquidation total achieved its most elevated daily measurement since September 2024.
"If spot demand follows, this squeeze could be the first sign the downside trend is running out of steam," crypto exchange Bitfinex wrote in an X reaction.
PCE and GDP headline turbulent macroeconomic week
Given that US markets will be shuttered for the Presidents' Day holiday Monday, significant economic data releases — along with any corresponding risk-asset volatility — are scheduled for later in the week.
The most significant among the forthcoming data releases is the Personal Consumption Expenditures (PCE) Index, recognized as the Federal Reserve's "preferred" measure of inflation. Fourth-quarter GDP figures are scheduled for release on the same day, Friday.
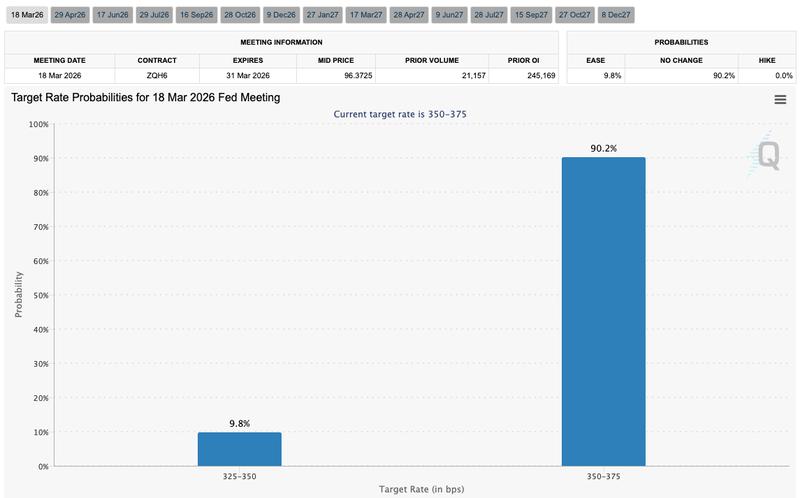
The PCE data arrives at a crucial juncture for Fed monetary policy — recent inflation statistics have presented a contradictory picture of economic conditions, creating market uncertainty. Market expectations for the Fed to resume policy easing at its March meeting remain subdued, despite last week's Consumer Price Index (CPI) registering below forecasts.
Based on CME Group's FedWatch Tool, the probability that policymakers will maintain interest rates at their present levels next month stands above 90%.
"Expect more volatility this week," trading resource The Kobeissi Letter told X followers while summarizing the upcoming macro events.
"Meanwhile, geopolitical tensions remain and macroeconomic uncertainty is elevated."
"The report is clouding the outlook for further rate cuts by the Federal Reserve, with market-implied odds pointing to two quarter-point rate cuts later this year. However, the 2-year Treasury yield that leads changes in the fed funds rate is near the low end of the current fed funds range and suggests no cuts at all," it noted.
Market analysis highlights mid-$50,000 price zone
In newly published market research released Monday, onchain analytics platform CryptoQuant stated that future BTC price floor levels will progressively depend on "investor resilience."
Examining the first half of February, contributor GugaOnChain cautioned that a critical test could materialize at the intersection of two important price levels beneath $60,000.
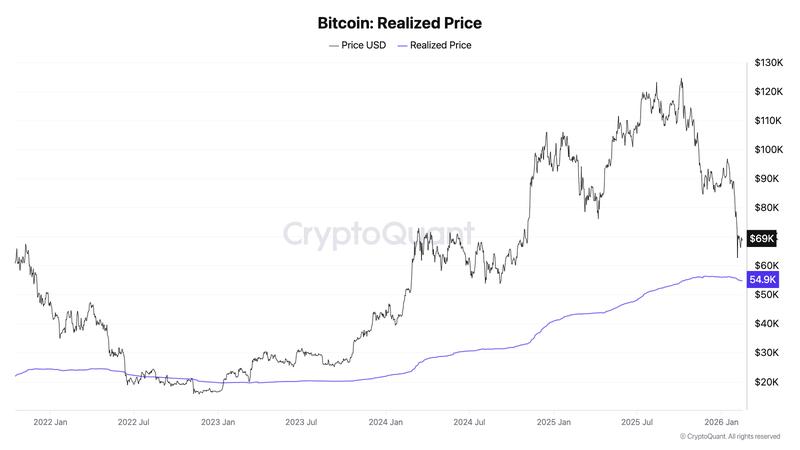
At this confluence, Bitcoin's 200-week simple moving average (SMA) intersects with its aggregate realized price — the average cost basis at which the circulating supply last transacted onchain.
"Bitcoin's 50% collapse toward the 200-period moving average on the weekly timeframe — which converge with the region of its realized price at $55,800 — will be a significant test, besides being seen by analysts as a region conducive to accumulation," GugaOnChain wrote in a Quicktake blog post.
"However, the turn toward recovery now depends on investor resilience."
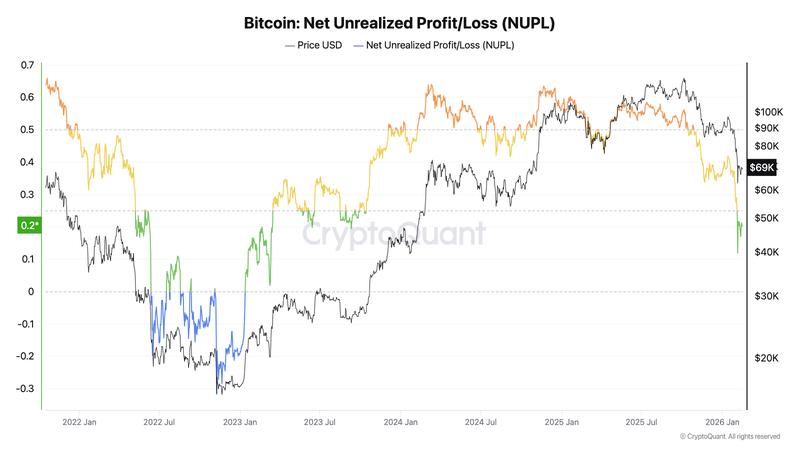
The analysis also drew attention to relatively depressed readings on the net unrealized profit/loss (NUPL) indicator — a benchmark for assessing overall BTC holdings' profitability status.
NUPL is currently registering 0.201, having recovered from lows of 0.11 observed on Feb. 6. The latter measurement represents the metric's most depressed level since March 2023.
GugaOnChain characterized NUPL as existing "in the fear region."
Bitcoin may still be searching for "authentic bottom"
Additional onchain profitability indicators go even further, cautioning that the present BTC price correction might merely represent the beginning of a "regime change."
For this assessment, CryptoQuant utilized the adjusted spent output profit ratio (aSOPR) — a metric that calculates the ratio of coins transacting onchain at elevated prices relative to their prior transaction values.
The aSOPR metric excludes coins that transacted multiple times within a one-hour timeframe, effectively filtering out "noise" from transactions that don't necessarily indicate actual losses for the holder.
On Feb. 6, the indicator fell beneath its neutral breakeven threshold of 1, signaling realized losses on a magnitude not witnessed since 2023 and the conclusion of Bitcoin's most recent bear market.
"In 2019 and 2023, similar readings occurred during deep corrective phases where coins were being spent at a loss," contributor Woo Minkyu commented in another Quicktake post.
"Each time, this zone represented capitulation pressure and structural reset. Now, aSOPR is again pressing into that same region."
Woo characterized the current market structure as one that "resembles prior bear transition phases."
"Unlike mid-cycle pullbacks where aSOPR quickly reclaims 1.0, this move shows sustained weakness and loss realization. If aSOPR fails to reclaim 1.0 soon, this increases the probability that we are not in a simple correction — but transitioning into a broader bear phase," he warned.
The aSOPR metric is presently measuring 0.996, having achieved only fleeting spikes above the breakeven point throughout the past month.
"aSOPR is signaling structural deterioration. This looks less like a dip, and more like a regime shift," Woo concluded.
"The real bottom may still require deeper compression before a durable reversal forms."