March 4 Crypto Forecast: BTC, ETH, BNB, XRP, SOL, DOGE, ADA, BCH, HYPE, LINK
On Wednesday, Bitcoin's upward momentum accelerated as the digital asset surged past the $74,000 mark, supported by continuous capital flowing into spot Bitcoin ETFs. What do the technical indicators reveal about BTC and altcoin price movements?

Main highlights:
Bitcoin's robust rebound beyond $74,000, supported by substantial capital inflows into US spot Bitcoin ETFs, indicates the potential establishment of a near-term price floor.
Numerous prominent altcoins are working to join the upward trend by breaking through their resistance barriers.
On Wednesday, Bitcoin (BTC) bulls demonstrated significant strength by driving the price upward to $73,800. An encouraging indicator favoring the bulls is that this recovery effort is accompanied by purchasing activity in US spot BTC exchange-traded funds, which have recorded $683.3 million in capital inflows during the current week according to data from SoSoValue.
Certain market analysts are of the opinion that BTC may be establishing a price floor. Jan van Eck, CEO of VanEck, stated on CNBC that BTC is currently in the fourth year of its historical four-year cycle, characterized by three years of appreciation followed by a decline in the fourth year. He indicated that his company believes BTC is approaching a bottom and anticipates a gradual upward trajectory beginning this year.
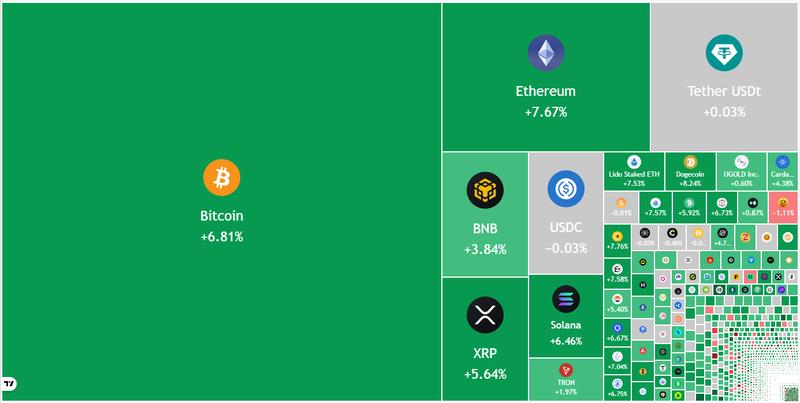
In an independent market analysis, 10x Research noted that BTC failed to collapse on risk-off news, suggesting that downward pressure may be diminishing. Nevertheless, the research team stated that BTC continues to trade in bear market territory, characterizing the bullish positioning as "tactical rather than structural."
Will BTC and selected major altcoins continue to extend their recovery? Let's examine the charts of the top 10 cryptocurrencies to determine potential outcomes.
Bitcoin price prediction
BTC's symmetrical triangle formation broke out to the upside when the price moved above the resistance line, signaling robust purchasing activity by the bulls.
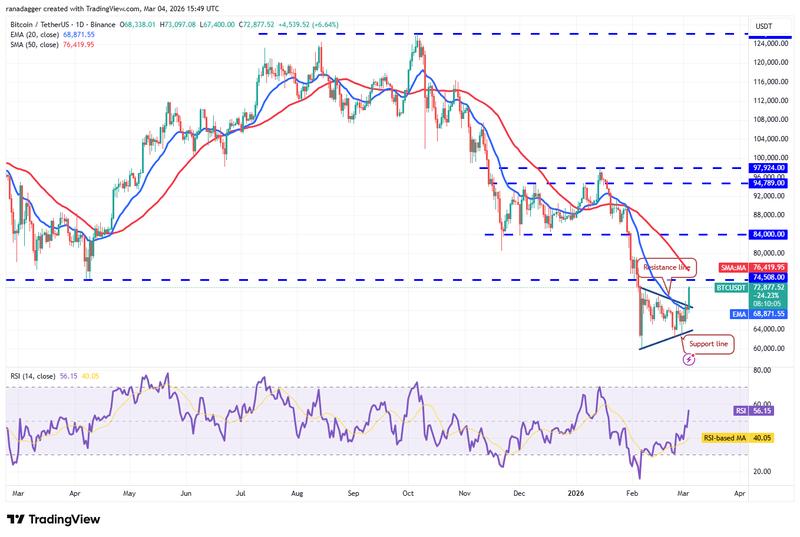
The BTC/USDT pair could advance toward the $74,508 price level, where sellers are anticipated to mount a significant defense. Should the Bitcoin price retreat from $74,508 but find support at the 20-day exponential moving average ($68,871), this would indicate bullish sentiment. Such a scenario enhances the probability of an advance to $84,000.
Conversely, should the price experience a sharp reversal from $74,508, this would suggest that bears are working to convert the level into a resistance zone. A closing price beneath the 20-day EMA would shift the advantage back toward the bears.
Ether price prediction
Ether (ETH) is working to break through the formidable overhead resistance located at $2,111, signaling vigorous buying activity from the bulls.
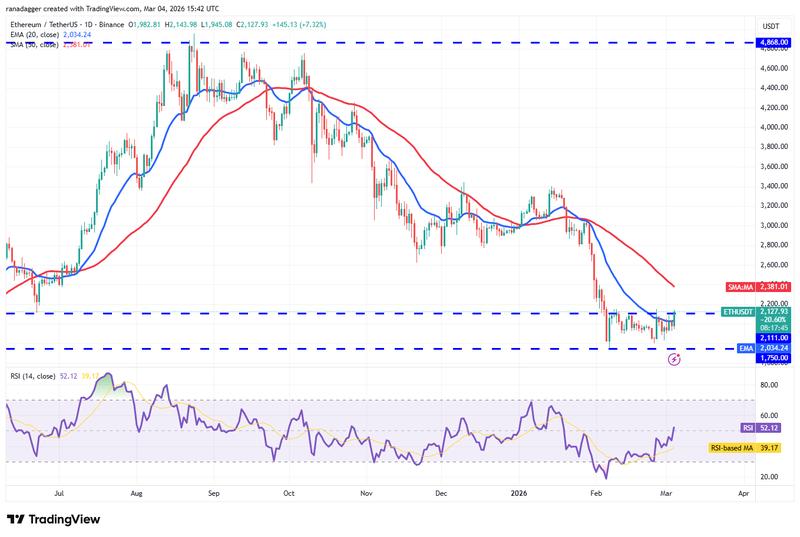
A closing price above the $2,111 level opens the pathway for an advance to the 50-day simple moving average ($2,381). Sellers will once more attempt to stop the recovery at the 50-day SMA, given that a breakout above this level would suggest the corrective phase could be concluding.
This optimistic outlook will be negated in the near term should the Ether price reverse sharply from $2,111 and plummet beneath the $1,907 level. This would indicate that the ETH/USDT pair may continue its consolidation between $2,111 and $1,750 for several additional days.
BNB price prediction
BNB (BNB) rallied beyond the 20-day EMA ($636) on Wednesday, signaling that the bulls have gained control over the bears.
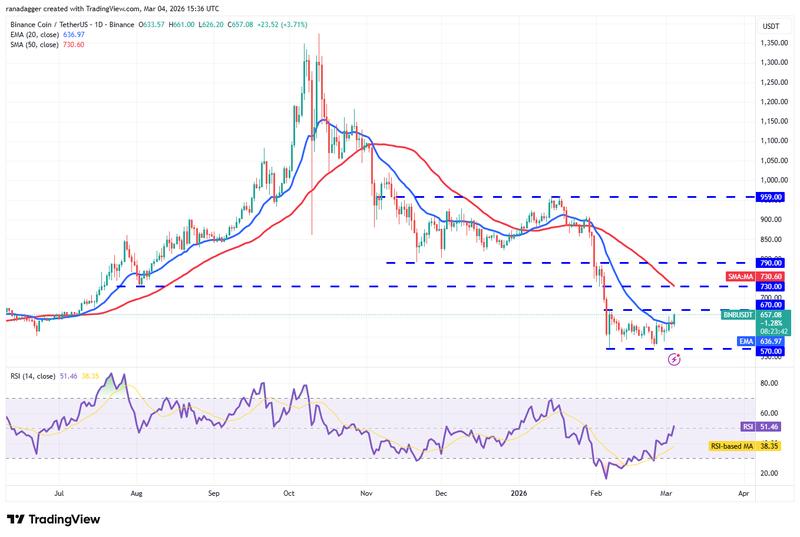
Buyers will work to capitalize on this momentum and overcome the $670 barrier. Should they succeed, the BNB/USDT pair could advance to $730. Sellers are expected to mount a defense at the $730 level, as a closing price above this threshold would suggest the pair may have established a near-term bottom. The BNB price could then progress toward $790.
On the other hand, should the price reverse sharply from $670, this signals that upward movements are encountering selling pressure. This scenario may keep the pair confined within the $570 to $670 range for additional time.
XRP price prediction
XRP (XRP) has been fluctuating in close proximity to the 20-day EMA ($1.42) for multiple days, suggesting that the bulls have maintained their momentum.
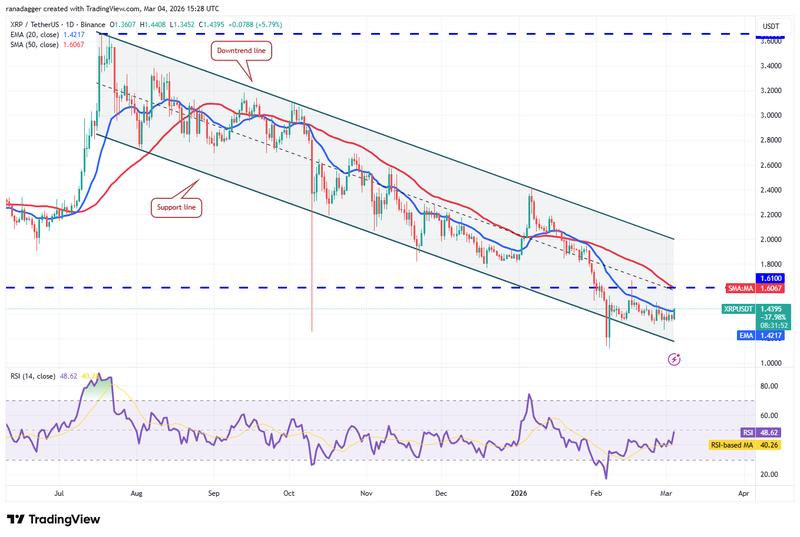
Should the price close beyond the 20-day EMA, the XRP/USDT pair could climb toward the downtrend line. Buyers will need to secure a closing price above the downtrend line to indicate a possible trend reversal.
Alternatively, should the XRP price turn downward from the 50-day SMA ($1.60) or the downtrend line, this suggests that bears continue to sell into rallies. This scenario may keep the pair confined within the channel for several more days.
Solana price prediction
Solana (SOL) has been trading within a consolidation range between $76 and $95 over the past several days, suggesting buying interest at lower price levels.
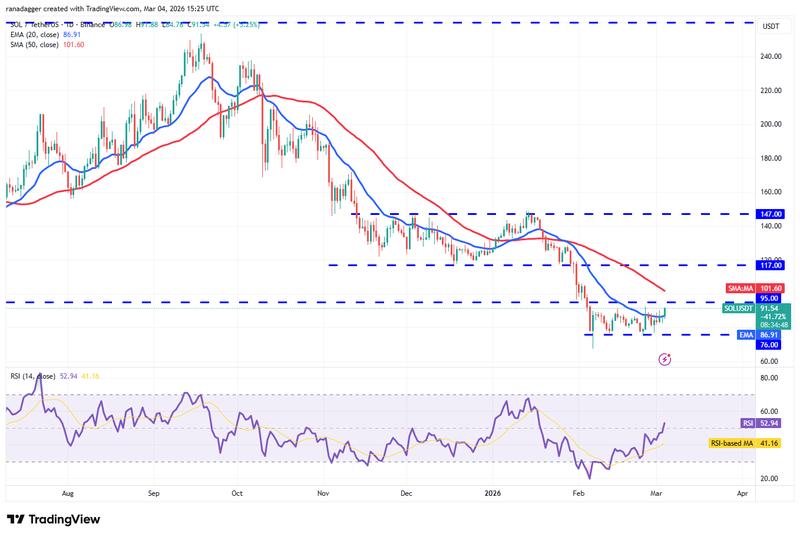
The leveling 20-day EMA ($86) combined with the RSI positioned slightly above the midpoint indicates diminishing selling pressure. Buyers will work to strengthen their position by driving the Solana price beyond the $95 level. Should they accomplish this objective, the SOL/USDT pair could surge toward $117.
Sellers likely have different intentions. They will work to defend the $95 level and maintain the price within the current range for an extended period.
Dogecoin price prediction
The inability of the bulls to drive Dogecoin (DOGE) beyond the 20-day EMA ($0.10) indicates that the bears maintain their selling pressure.
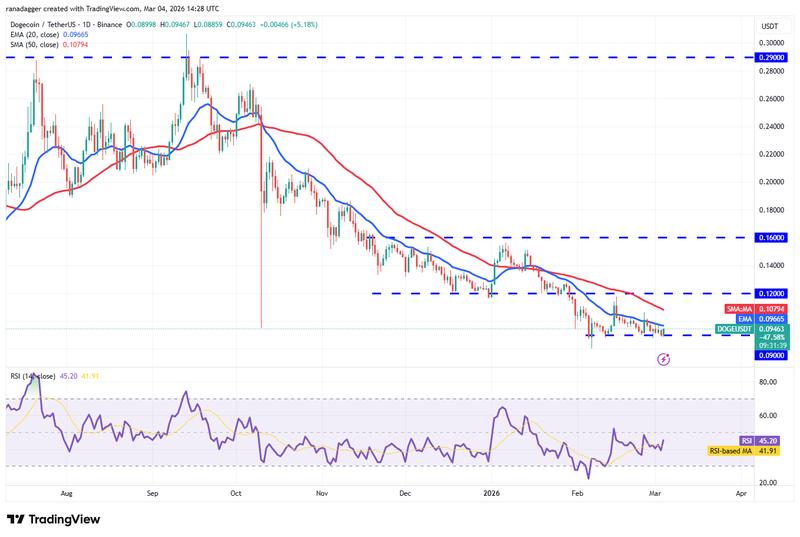
This situation elevates the probability of a decline beneath the $0.09 support. Should this occur, the DOGE/USDT pair could fall to the Feb. 6 low of $0.08. This represents a critical level requiring close attention, as a closing price below $0.08 could drive the pair downward to $0.06.
The initial indication of bullish strength would be a closing price above the 20-day EMA. The Dogecoin price could then advance to the 50-day SMA ($0.11) and subsequently to the significant overhead resistance at $0.12.
Cardano price prediction
Cardano (ADA) experienced a reversal from the 20-day EMA ($0.27) on Tuesday, suggesting that the bears continue to protect this level.
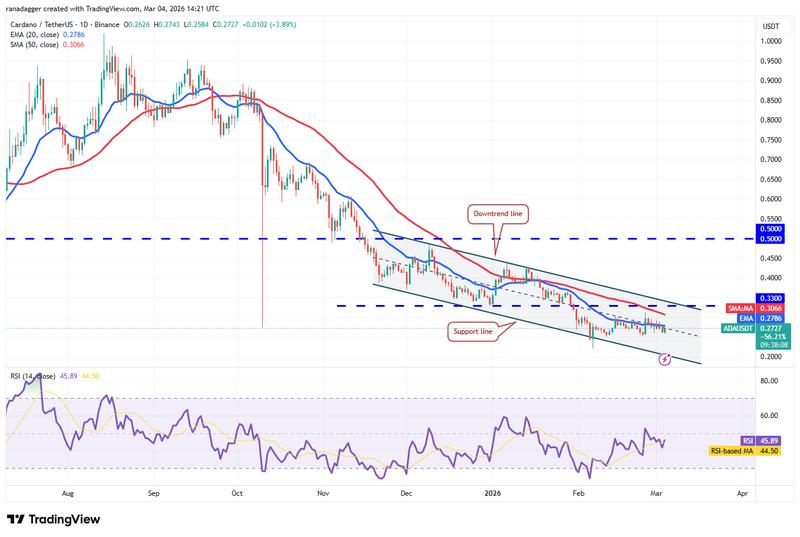
A slight positive factor supporting the bulls is their ability to maintain price levels without significant losses to the bears. This indicates buying activity on every minor dip, raising the probability of a breakthrough above the 20-day EMA. The ADA/USDT pair could then advance to the downtrend line of the descending channel pattern.
Buyers will need to drive and sustain the Cardano price above the downtrend line to indicate a potential near-term trend reversal. The pair could then ascend to $0.43.
Bitcoin Cash price prediction
Sellers were unable to keep Bitcoin Cash (BCH) beneath the $443 level, suggesting limited selling interest at lower price levels.
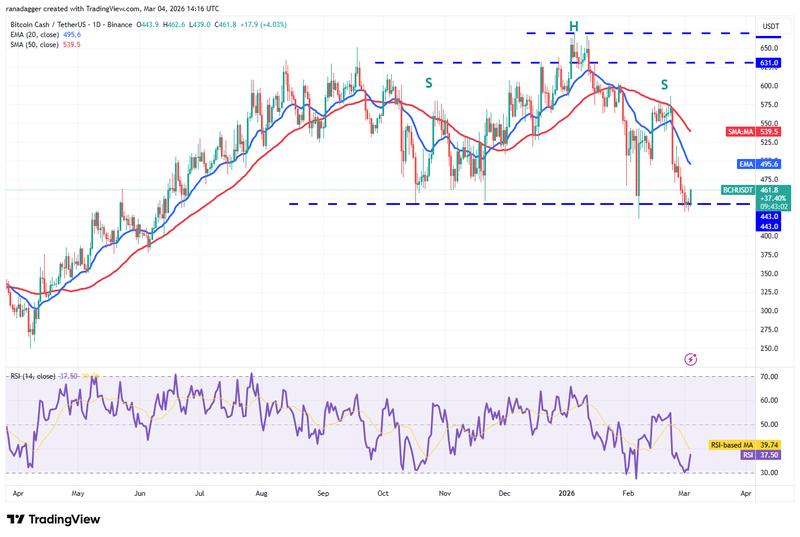
The bulls are working to initiate a relief rally, which will likely encounter resistance at the 20-day EMA ($495). Should the Bitcoin Cash price reverse sharply from the 20-day EMA, this elevates the probability of a breakdown below the $443 support. Should this scenario unfold, the BCH/USDT pair will complete a bearish head-and-shoulders pattern, initiating a downward movement to $375.
Buyers will need to secure a closing price above the 50-day SMA ($539) to regain control. The pair could then ascend to $600.
Hyperliquid price prediction
Hyperliquid (HYPE) rebounded from the 20-day EMA ($30.16) on Wednesday, suggesting that the bulls are actively purchasing during price dips.
The bulls will work to drive the Hyperliquid price to the $36.77 resistance, where the bears are anticipated to mount a vigorous defense. Should the price reverse sharply from the overhead resistance, this indicates that the HYPE/USDT pair could trade within a range between $20.82 and $36.77 for an extended period.
In contrast to this scenario, should the bulls break through the $36.77 resistance, this signals the commencement of a fresh upward movement. The pair could then rally to $43.50 and thereafter to $50.
Chainlink price prediction
Chainlink (LINK) has been maintaining its position near the 20-day EMA ($8.96) over the past several days, suggesting an intense struggle between the bulls and the bears.
The leveling 20-day EMA combined with the RSI positioned near the midpoint indicates diminishing selling pressure. This enhances the likelihood of an advance to the 50-day SMA ($10.10) and thereafter to the breakdown level of $10.94. Buyers are anticipated to encounter substantial selling pressure within the $10.94 to $11.61 zone.
This optimistic outlook will be invalidated in the short term should the Chainlink price turn downward and break beneath the $8 level. The LINK/USDT pair could then retest the Feb. 6 low of $7.15.
This article does not contain investment advice or recommendations. Every investment and trading move involves risk, and readers should conduct their own research when making a decision.