Historic SOL Chart Pattern That Sparked 142% Surge Emerges Once More: Bull Market Revival?
Solana's SOL token displays a technical formation that historically triggered massive triple-digit price surges. Could altcoin investors be preparing for another breakout to record levels?

A technical pattern that has historically marked major bottoms for Solana's SOL token has reappeared on its weekly chart. This formation initially emerged in 2023, preceding a massive 1,604% price rally, and then resurfaced in 2025 ahead of a 142% gain for the altcoin.
At present, both SOL futures and spot market indicators suggest a gradual increase in trading activity, with the asset's price moving toward a critical weekly threshold that could strengthen the optimistic outlook.
Technical analyst WebTrend has pointed out that this weekly chart formation is characterized by successive candles displaying extended lower wicks. Such a structure typically indicates that downward pressure is being neutralized as purchasing interest repeatedly emerges at reduced price points.
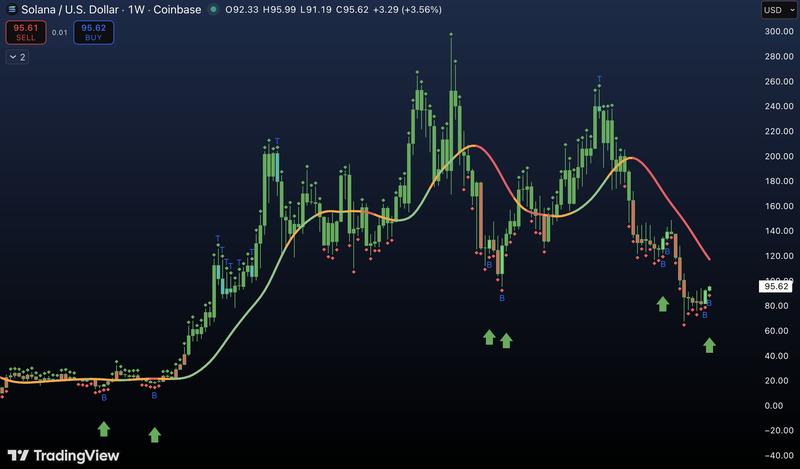
We are currently confirming a macro bottom setup with the same signal that successfully called the 2 most meaningful bottoms in the last 3 years.
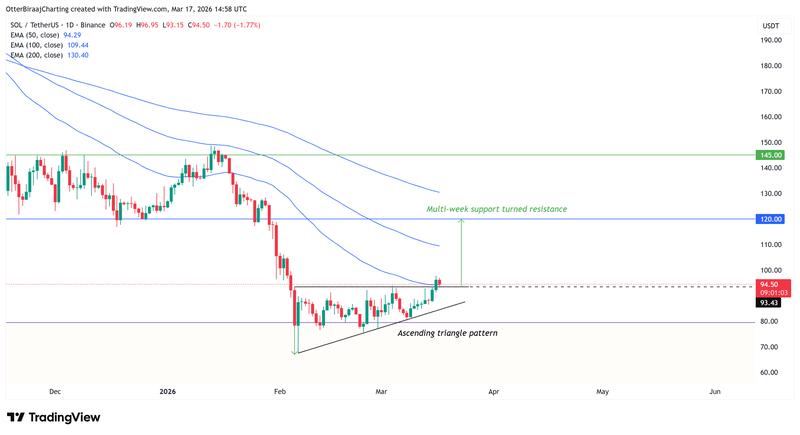
Cryptocurrency trader Bluntz observed that Solana appears to have finalized an accumulation period after experiencing a significant breakout on its daily timeframe. This movement corresponds with an ascending triangle breakout pattern where increasingly higher daily lows converge with a horizontal resistance zone. The token's price is currently maintaining a position above $93.50, an important threshold that functioned as resistance in prior periods.
According to the technical pattern, the subsequent upside objective is positioned around $120, a price point that functioned as a support zone throughout much of 2024 and 2025. Should this level be successfully reclaimed, it could serve as a robust foundation for additional gains, with $145 representing the next viable target if positive momentum persists.
Market activity shows early recovery signs
Although the price formation appears promising, derivatives market data indicates the recovery phase is still in its early stages.
The open interest for SOL has stayed under $2.3 billion since Feb. 6 when the price reached its bottom, demonstrating that market participants are not yet substantially increasing their leveraged positions. This reflects a more cautious trading atmosphere rather than conditions typically associated with an extended upward rally.
Regarding spot market activity, the cumulative volume delta (CVD), an indicator that monitors the net balance between buying and selling activity, has achieved stability during the previous month, demonstrating that downward pressure has diminished.
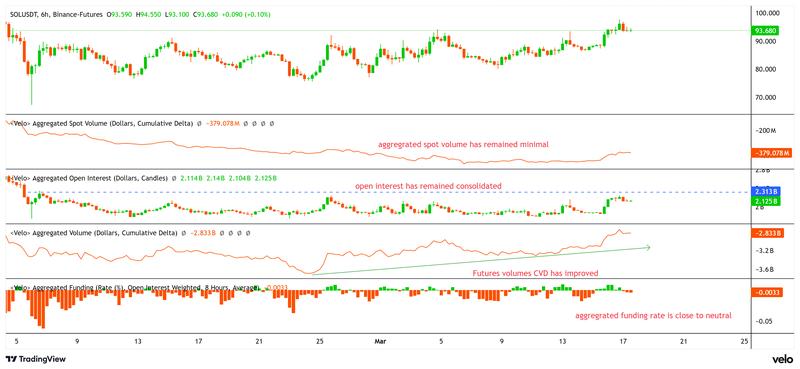
Within the futures trading environment, the CVD has shown improvement, moving to -$2.8 billion from -$3.5 billion since Feb. 24, representing a $700 million decrease in selling activity. This development indicates that although negative pressure is subsiding, substantial buying demand has not yet materialized.
The aggregated funding rate has likewise maintained a neutral position, indicating that neither optimistic nor pessimistic trading positions are currently prevailing in the market.
Taking everything into account, the available data indicates a recovery primarily driven by spot market activity. The $120 price level continues to represent a crucial area deserving close attention, serving as a significant benchmark for both trader positioning strategies and broader market sentiment.
This article does not contain investment advice or recommendations. Every investment and trading move involves risk, and readers should conduct their own research when making a decision. While we strive to provide accurate and timely information, Cointelegraph does not guarantee the accuracy, completeness, or reliability of any information in this article. This article may contain forward-looking statements that are subject to risks and uncertainties. Cointelegraph will not be liable for any loss or damage arising from your reliance on this information.