Futures market signals bearish momentum building toward Bitcoin's $60K level
After being turned away at the $70,000 mark, Bitcoin faces downward pressure with a significant liquidity gap creating vulnerability around the $60,000 threshold, according to market experts.
The price of Bitcoin (BTC) declined to $65,800 during Wednesday's trading session, falling beneath critical intraday technical indicators and sparking fears that the previous week's descent to $60,000 might not represent the ultimate floor. Market observers now indicate that the likelihood of another decline toward the yearly bottom at $59,800 is becoming more probable, driven by an expanding liquidity vacuum spanning from $66,000 down to $60,000.
Key takeaways:
- A pattern of descending peaks has emerged for Bitcoin following successive failures near the $70,000–$72,000 resistance area.
- The relative strength index (RSI) is moving closer to oversold territory while the asset trades beneath important moving averages.
- Analysis of the liquidation heatmap revealed a lack of liquidity extending down to $60,500, maintaining the probability of downward price action.
Bitcoin's near-term outlook dims following $70,000 breakdown
Analysis of Bitcoin's one-hour price chart reveals several unsuccessful efforts to maintain levels above $70,000. Every rejection point has resulted in progressively lower peaks and consistent downward pressure from sellers.
The price of BTC momentarily climbed to intraday peaks of $69,800 before experiencing a sharp reversal throughout Wednesday's New York trading hours, creating a textbook example of a swing failure pattern. This movement caught long position holders off guard and intensified the bearish momentum.
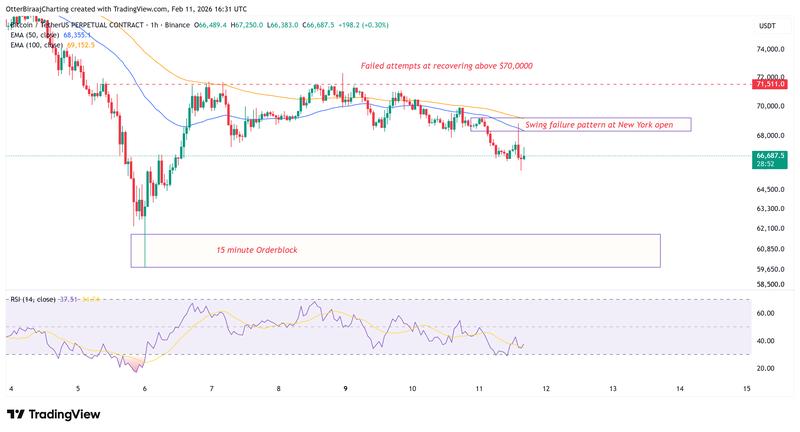
Additionally, BTC was trading beneath both its 50-period and 100-period exponential moving averages, validating that bears maintain short-term dominance. The relative strength index (RSI) continued to register below the 50 mark, suggesting minimal upward buying momentum.
An order block on the 15-minute timeframe is positioned around the $60,800–$61,000 zone, representing an area where substantial buying interest previously emerged following BTC's establishment of a yearly low at $59,800. Should the $64,000 level fail to provide support, this region becomes a prime liquidity destination.
Liquidity analysis points to $60,000 as primary target
Examination of Bitcoin's liquidity heatmaps shows concentrated orders positioned above the $72,000 level, while simultaneously exposing a significant "liquidity void" stretching from $66,000 down to $60,500. Such liquidity voids frequently function as price magnets, as markets tend to traverse low-liquidity zones rapidly in pursuit of dense stop-loss clusters positioned below.
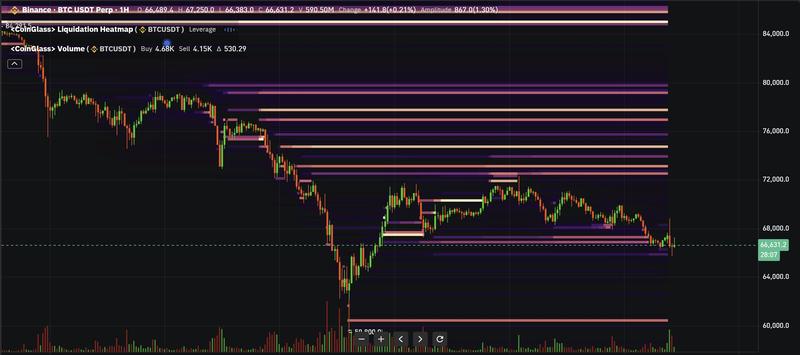
While greater liquidity concentration exists at higher price levels, the downside path remains accessible given that a substantial accumulation of leveraged long positions exceeding $350 million continues to sit near the $60,500 mark.
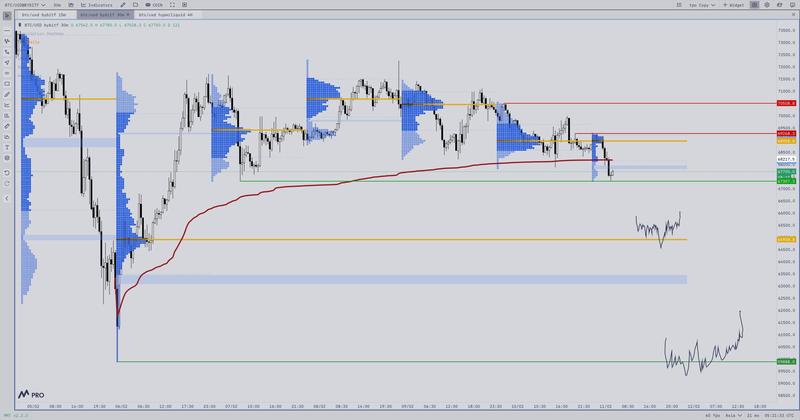
Market trader Husky observed that Bitcoin is falling beneath the anchored volume-weighted average price (VWAP) calculated from the previous week's bottom at $59,800, a threshold currently serving as short-term equilibrium.
Given that the broader market framework is beginning to deteriorate, failure to achieve a rapid rebound above $68,000 heightens the probability of additional downside movement toward lower support zones around $65,000. For the immediate future, Bitcoin is anticipated to remain confined within a wide $60,000 to $72,000 trading corridor, the trader suggests.
Similarly, technical analyst EliZ highlighted that BTC is experiencing consolidation around $66,500 within the boundaries of a descending channel pattern. A breakdown beneath this threshold could drive the price toward the $63,400–$64,600 support area, elevating the probability of a return visit to the $60,000 level.
This article does not contain investment advice or recommendations. Every investment and trading move involves risk, and readers should conduct their own research when making a decision. While we strive to provide accurate and timely information, Cointelegraph does not guarantee the accuracy, completeness, or reliability of any information in this article. This article may contain forward-looking statements that are subject to risks and uncertainties. Cointelegraph will not be liable for any loss or damage arising from your reliance on this information.