ETH Taker Volume Reaches Highest Point Since 2022: Can Ethereum Prevent a 19% Drop?
Ethereum has triggered a powerful bullish indicator last observed in 2022, though the cryptocurrency must maintain support above a critical threshold to preserve the technical formation.

An important onchain metric for Ether (ETH) has reached its most elevated point in more than three years, matching levels previously recorded when ETH established a bottom during the bear market cycle of 2022.
This indicator strengthens the argument for a potential early bottoming formation, notwithstanding the lackluster spot market demand and subdued price performance. Available data points to the possibility that ETH could find stability around the regional support near $2,000, though there's still a chance that lower price levels could be tested in the weeks ahead.
Surge in Ether taker flow: Is this validation of ETH's bottom?
On March 17, the 30-day moving average for positive Ether net taker volume rose to $142 million, matching levels previously observed on July 18, 2022. Net taker volume calculates the differential between aggressive purchasing and selling activity within derivatives trading venues.
When this metric registers positive values, it indicates that market orders are tilted toward the buy side. This recent increase corresponds with previous spikes documented during mid-2022 throughout a corrective market phase.
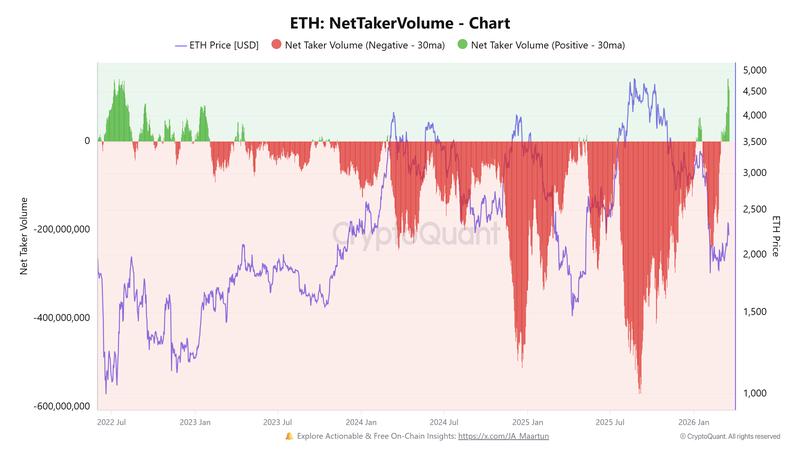
Such expansions have historically materialized during transitional market periods when participants reallocate positions and increase their exposure as prices find equilibrium near market lows, as was witnessed during July 2022 and August 2020.
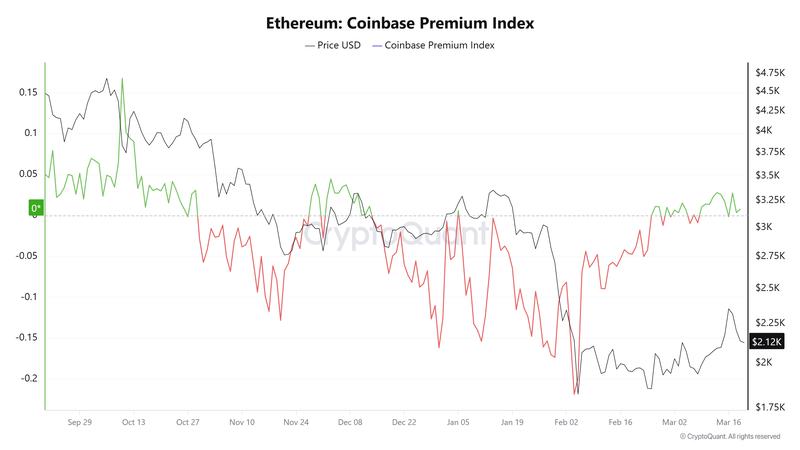
Additionally, the Ethereum Coinbase premium index has maintained positive territory since Feb. 24, with these heightened premium readings suggesting increased spot market demand originating from traders based in the United States.
Nevertheless, cryptocurrency analyst Pelin Ay observed that notwithstanding the reduction in selling pressure, the price reaction has stayed comparatively restrained, potentially attributable to an absence of substantial buying demand. The analyst said,
"The supply side is bullish, but there are no buyers. It appears that buyers still consider the current price expensive and are waiting for a new bottom."
What are the implications if Ether drops beneath $2,150?
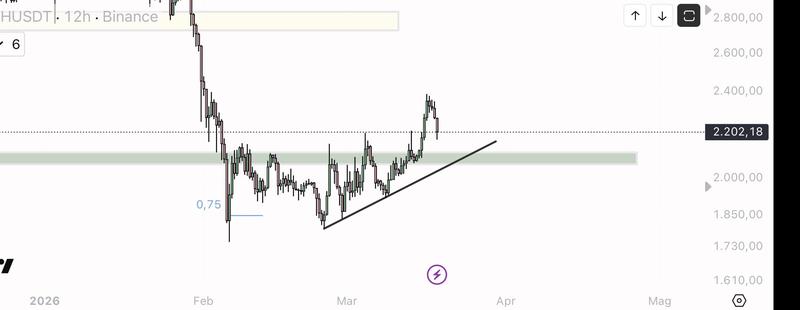
The near-term support level for Ether corresponds with the 100-period and 200-period exponential moving averages (EMAs), though the price is consolidating around an upward-sloping trendline, with a potential breach directing attention toward the lower liquidity regions.
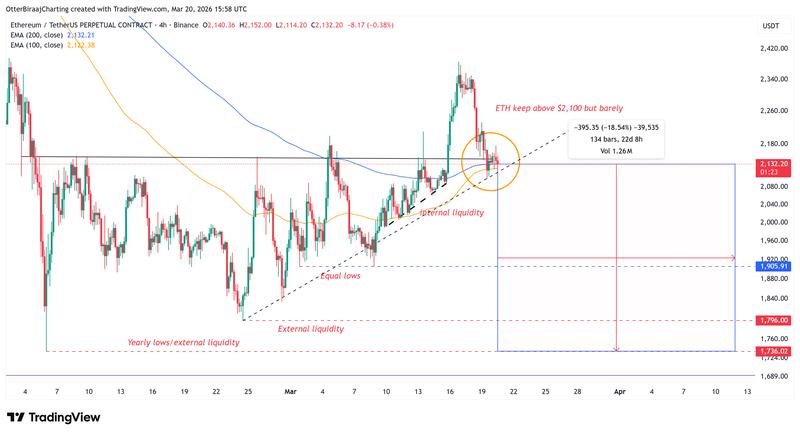
Internal liquidity is concentrated in the range between $2,100 and $2,000, while a more significant cluster has developed around $1,905.
An even larger concentration of liquidations exists at $1,976, where more than $3 billion worth of long positions remain open. A decline into this zone could initiate cascading liquidations and generate a temporary market imbalance.
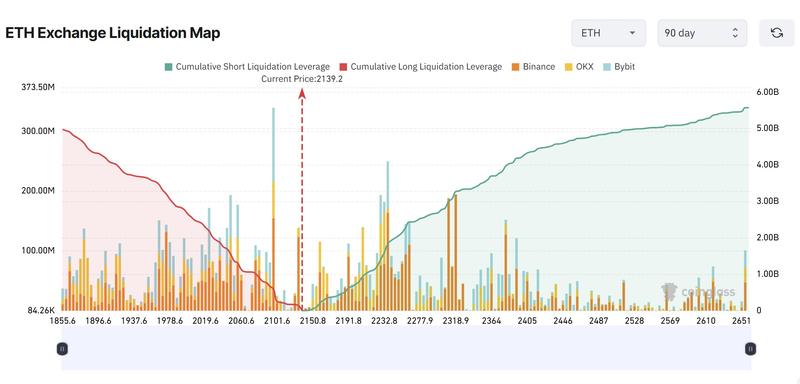
Should buyers emerge, this region could alternatively function as a demand area and facilitate a price recovery back above $2,000.
Cryptocurrency trader EliZ identified a definitive threshold at $2,000 on the daily chart timeframe. Sustaining prices above this benchmark preserves the intermediate-term trend structure. A breakdown below this level would shift positioning toward aggressive short-side exposure, bringing lower price targets into consideration.