ETH Poised for 200% Surge as Historic Global Liquidity Pattern Re-Emerges
A combination of whale-level ETH accumulation and the return of a historically significant global liquidity pattern suggests Ethereum may be positioning for another massive triple-digit price surge.

Ethereum (ETH) is currently displaying a macroeconomic pattern that bears striking resemblance to conditions that preceded a substantial price rally in 2021. A market analyst has identified a repeating sequence that connects global liquidity dynamics, US small-cap stock performance, and Ethereum's price trajectory, indicating the altcoin could experience a comparable surge.
Key takeaways:
- Ethereum experienced a 226% price increase in 2021 following the achievement of a critical global liquidity milestone.
- Accumulation addresses for ETH demonstrate an ascending realized price approaching $2,700, strengthening the structural price floor.
ETH faces 2021-style breakout as global liquidity pattern repeats
Market analyst Sykodelic has identified a cyclical pattern that connects global liquidity dynamics, the Russell 2000 index performance, and Ethereum's prospective price breakout.
The pattern consists of a three-phase sequence: an initial breakout in global liquidity levels, subsequently followed by a breakout in the Russell 2000 index, culminating in a lagged breakout for Ether. According to the current monthly chart analysis, this identical sequence has materialized once again.
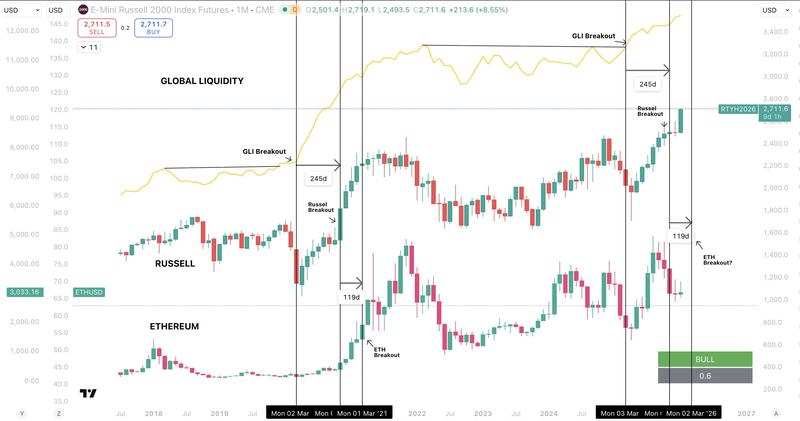
According to Sykodelic's analysis, global liquidity has completed its breakout phase, with the Russell 2000 subsequently following suit. Ether has historically exhibited a lagging response to this movement, with breakouts typically occurring multiple weeks after the initial signals.
During 2021, ETH initiated its significant rally approximately 119 days following the Russell's confirmed breakout. Following this historical timeline, ETH may experience a breakout around March 2026.
The monthly candlestick pattern on the Russell is demonstrating a close correlation to the previous cycle, indicating a comparable risk-on market environment. During the previous occurrence of this alignment, Ethereum experienced a 226% surge spanning from March 2021 through November 2021.
This observation reinforces the perspective that macroeconomic liquidity dynamics, as opposed to near-term technical chart patterns, may establish the longer-term trajectory for high-beta digital assets such as ETH.
ETH accumulation data and Russell 2000 strength provide dual support
According to a statement on X by Max, the CEO of BecauseBitcoin, the Russell 2000 has demonstrated a historical pattern of leading Ethereum into phases of price discovery.
Given that the Russell 2000 achieved a fresh all-time high of 2,738 on Thursday, the analyst suggested that this leadership dynamic may once again support upward price movement for ETH throughout the upcoming weeks, provided the historical correlations remain intact.
Blockchain data continues to demonstrate sustained accumulation activity. Analysis from CryptoQuant reveals that the realized price for ETH accumulation addresses is experiencing upward movement and presently stands at approximately $2,720.
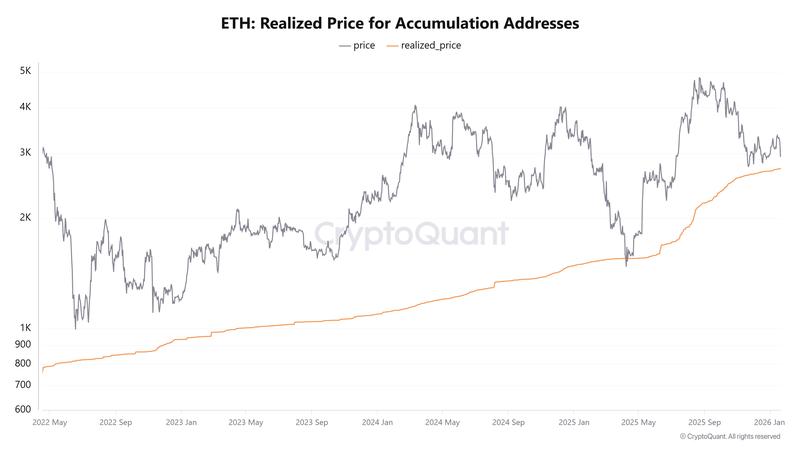
The realized price metric for accumulation addresses has consistently functioned as robust price support for long-term holders throughout history and has remained unbroken during previous market corrections. The close proximity between the realized price and the current spot price indicates that accumulation activity continues to persist, even amid market volatility.
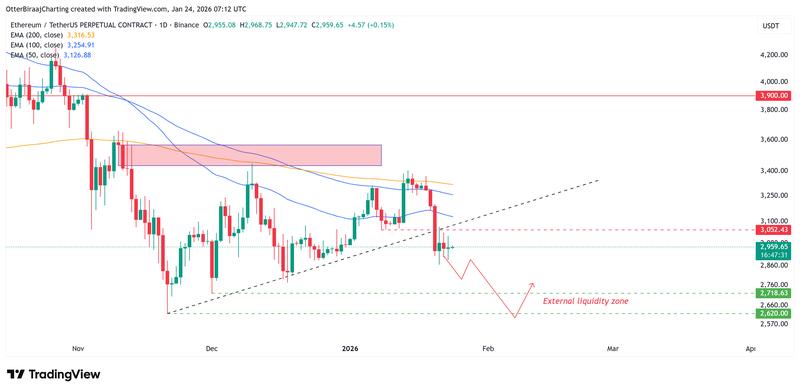
Should ETH retrace to this price zone, market analysts project that downside risk could be constrained to approximately 7%, establishing a potential local price floor in the vicinity of $2,720. This level additionally corresponds with external liquidity concentration zones, enhancing the probability of a trend-defining response should the level be tested.