Critical Support Zone Beneath $2,000 ETH Indicates Potential Direction for Ethereum
Ethereum's decline beneath the $2,000 threshold could signal the beginning of an extended bottoming period and consolidation phase, on-chain metrics and exchange flow data suggest.

On Tuesday, Ether (ETH) faced challenges maintaining price levels above the $2,000 mark, and within this context, market observers have pointed out that Ethereum's 31% decrease in 2026 follows a recognizable price pattern from earlier bull market cycles.
Key takeaways:
- The recent descent to $1,736 for ETH could represent just the initial low in a broader consolidation pattern.
- On-chain cost-basis metrics show concentration between $1,300 and $2,000, supporting this range as a probable accumulation zone.
Ethereum fractal suggests extended consolidation period ahead
When comparing long-term fractals between the 2021-2022 cycle and the 2024-2025 cycle, the data indicates that Ethereum's aggressive selloff follows a familiar blueprint where an early bottom emerges before price action retests deeper levels amid continued market pressure.
Looking at the weekly timeframe, ETH's decline to the $1,730 area appears to represent its "first low," as opposed to representing a conclusive market bottom.
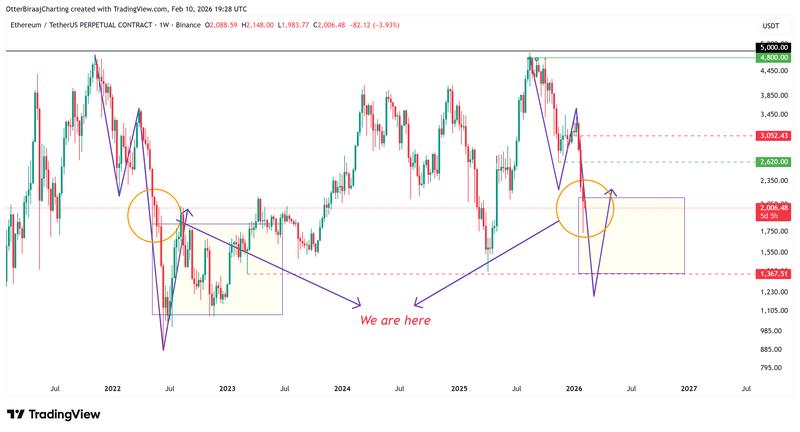
During 2021, ETH underwent a 12-month consolidation period oscillating between the initial low ($1,730) and a deeper support level ($885), which enabled overleveraged positions to unwind and spot market demand to gradually strengthen.
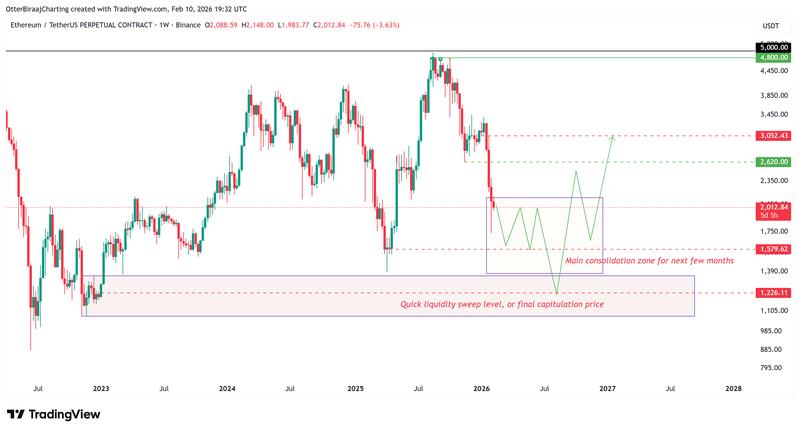
Using this historical blueprint as a guide, ETH could continue trading within an approximate range of $1,300 to $2,000, with potential downward probes toward the $1,500–$1,600 region likely before establishing a durable foundational base.
On-chain cost basis metrics identify $1,300–$2,000 as accumulation zone
The UTXO realized price distribution (URPD) data for Ethereum reinforces the likelihood of a prolonged consolidation phase. Significant supply concentrations remain positioned above current price levels, with $2,822 representing 5.86% of total ETH supply and $3,119 containing 6.15%, creating substantial overhead resistance.
Beneath current market prices, meaningful clusters emerge at $1,881 (1.58 million ETH) and $1,237, indicating possible accumulation zones should the price continue its retracement.
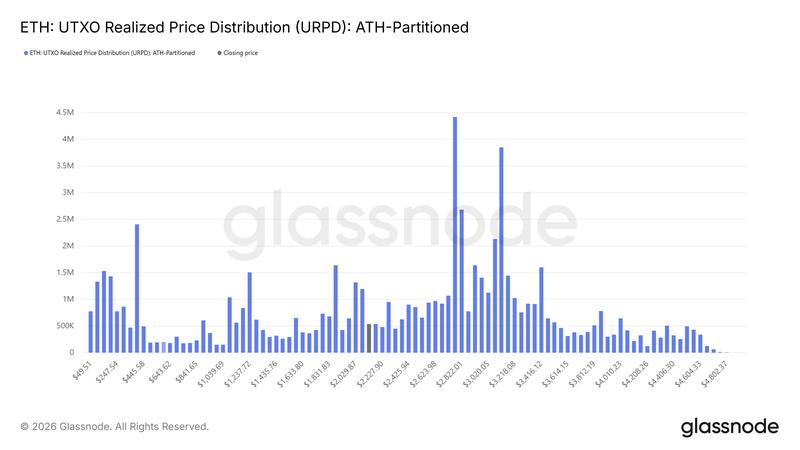
From a structural perspective, $1,237 emerges as a plausible cycle bottom, with intermediate support positioned near $1,584 and more robust acceptance levels around $1,881, where realized supply density intensifies.
Derivatives market data supports this perspective. The liquidation heat map reveals cumulative long position liquidations at risk totaling $4 billion to $6 billion, spanning from $1,700 down to $1,455, representing price levels that sellers could potentially target.
Conversely, over $12 billion in short position liquidity is concentrated up to $3,000, suggesting that following the absorption of downside liquidity, the directional momentum could pivot upward in the months ahead.
What factors are providing structural support for Ethereum?
According to data from CryptoQuant, Ethereum withdrawals from centralized exchanges have climbed to their highest point since October 2025, with net outflows surpassing 220,000 ETH. Last Thursday, Binance alone registered daily net outflows of approximately 158,000 ETH, marking the largest single-day outflow since August 2025.
These capital movements occurred while ETH was trading within the $1,800 to $2,000 range, indicating accumulation activity or defensive repositioning at these price levels.
Michaël van de Poppe, founder of MNCapital, emphasized a comparable dynamic, observing that price action frequently trails behind network expansion and narrative development.
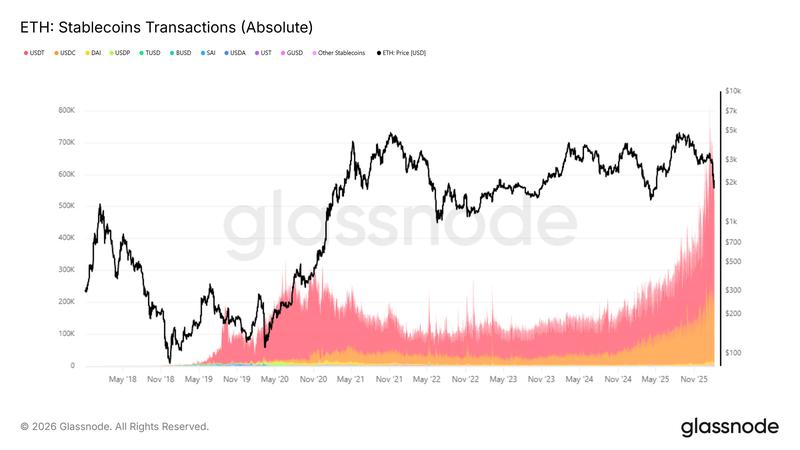
Transaction volume for stablecoins on the Ethereum network has increased by approximately 200% throughout the past 18 months, despite the ETH price remaining roughly 30% below previous levels, creating a divergence that could potentially trigger a parabolic revaluation for the altcoin.
This article does not contain investment advice or recommendations. Every investment and trading move involves risk, and readers should conduct their own research when making a decision. While we strive to provide accurate and timely information, Cointelegraph does not guarantee the accuracy, completeness, or reliability of any information in this article. This article may contain forward-looking statements that are subject to risks and uncertainties. Cointelegraph will not be liable for any loss or damage arising from your reliance on this information.