Contrarian analysts call $60K the floor for Bitcoin as market fear reaches unprecedented depths
The Fear & Greed Index for Bitcoin plummeted to an all-time low, prompting contrarian analysts to declare $60,000 as BTC's bottom. What does the historical record show?
On Monday, Bitcoin (BTC) managed to climb back above the $71,000 threshold following a dramatic plunge in sentiment indicators throughout the cryptocurrency marketplace to unprecedented depths.
Certain market observers suggested that conditions of "extreme fear" combined with available upside liquidity could provide support for Bitcoin to maintain levels above its annual bottom at $60,000, though skeptics cautioned that deteriorating market fundamentals and declining futures volume might drive valuations even further down.
Key takeaways:
- The Crypto Fear & Greed Index plunged to an unprecedented reading of 7, reflecting extreme fear among market participants.
- Upward of $5.5 billion in short position liquidations positioned above present price levels could potentially catalyze a recovery.
- Deteriorating price patterns and increasing derivatives market selling pressure could potentially drive Bitcoin beneath the $60,000 threshold.
Market sentiment and liquidation data point to $60,000 as a support floor
Michaël van de Poppe, who founded MN Capital, indicated that Bitcoin is displaying sentiment metrics that have historically coincided with market bottoms. Van De Poppe noted that the Crypto Fear & Greed Index had plummeted to 5 during the weekend period (with the final confirmed reading at 7), representing its most extreme reading ever recorded, while Bitcoin's daily relative strength index (RSI) has declined to 15, indicating severely oversold market conditions.
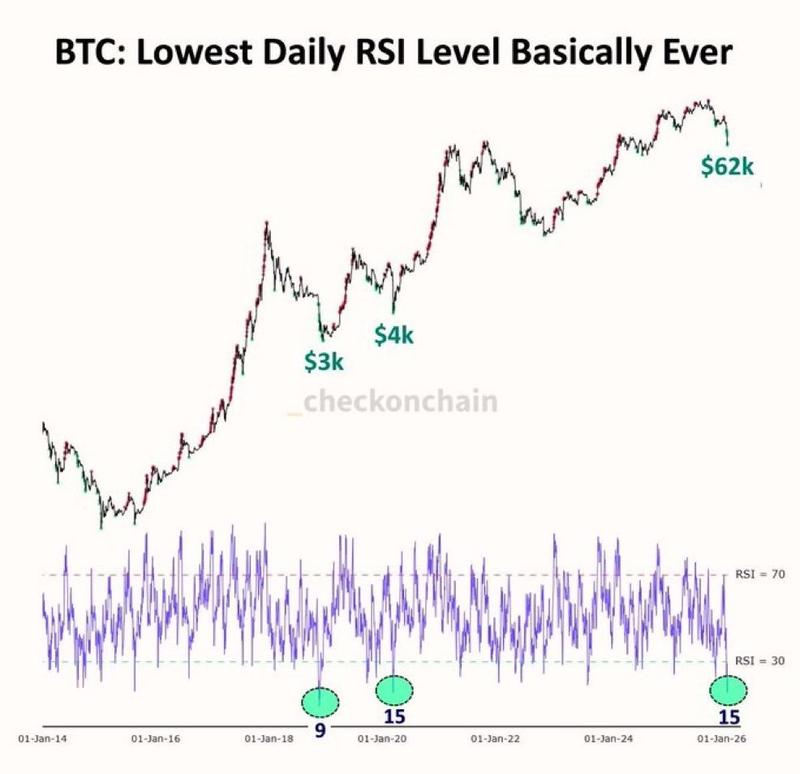
Such extreme readings haven't been observed since the 2018 bear market cycle and the March 2020 market crash triggered by COVID-19. According to Van de Poppe, these extreme conditions could enable BTC to demonstrate a recovery trajectory and potentially avoid an immediate retest of support at the $60,000 price point.
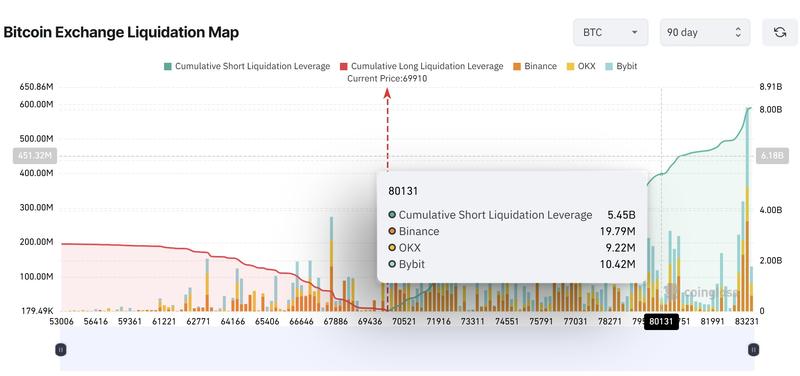
Supporting data from CoinGlass strengthens the optimistic outlook. The liquidation heatmap for Bitcoin reveals more than $5.45 billion in accumulated short position liquidations that would be triggered if prices advance approximately $10,000 from current levels, in stark contrast to $2.4 billion in potential liquidations should prices retest the $60,000 level.
This asymmetry in liquidation positioning indicates that a move to the upside could catalyze forced covering of short positions, potentially sparking a BTC price rally.
Structural vulnerabilities in BTC maintain focus on downside scenarios
According to data from CryptoQuant, Bitcoin is currently trading beneath its 50-day moving average positioned near $87,000, and significantly below the 200-day moving average hovering around $102,000. This substantial divergence between price and moving averages signals a corrective or "repricing" period following the previous upward movement.
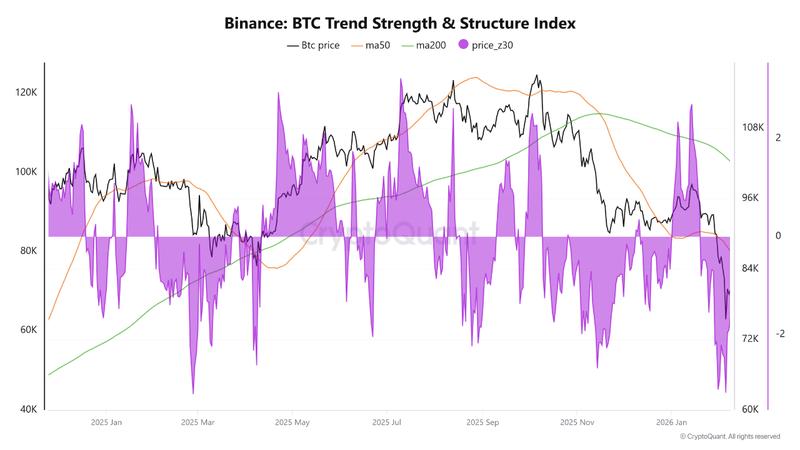
Additionally, CryptoQuant's Price Z-Score has turned negative at -1.6, demonstrating that BTC is currently trading beneath its statistical average, which serves as an indicator of elevated selling pressure and trend fatigue. Historically, such market conditions have preceded prolonged consolidation periods rather than quick recoveries.
Crypto market analyst Darkfost drew attention to increasing selling dominance within derivatives trading. The monthly net taker volume shifted sharply into negative territory at -$272 million on Sunday, while the taker buy-sell ratio on Binance has dropped below 1, both signaling intensifying selling pressure.
Given that futures market volumes are currently exceeding spot market activity, a strengthening of spot demand would be necessary to catalyze a bullish price response from BTC.
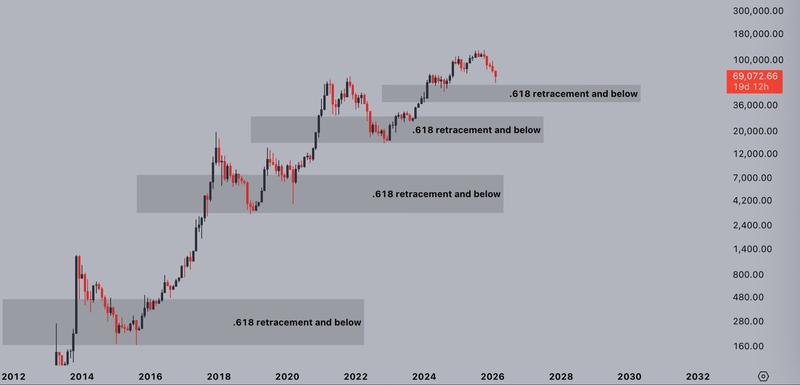
Introducing a more extended timeframe perspective, Bitcoin investor Jelle observed that historical Bitcoin bear market bottoms have formed beneath the 0.618 Fibonacci retracement level. In the present market cycle, that critical level is positioned near $57,000, with more severe downside possibilities extending to approximately $42,000 should historical patterns repeat themselves.
This article does not contain investment advice or recommendations. Every investment and trading move involves risk, and readers should conduct their own research when making a decision. While we strive to provide accurate and timely information, Cointelegraph does not guarantee the accuracy, completeness, or reliability of any information in this article. This article may contain forward-looking statements that are subject to risks and uncertainties. Cointelegraph will not be liable for any loss or damage arising from your reliance on this information.