BTC Plunges Nearly 10% as Questions Mount Over Questionable Price Support Levels
The leading cryptocurrency has experienced a correction approaching 10% from recent peaks, with mounting concerns about the reliability of key long-term support zones for BTC prices.

Analysis suggests that Bitcoin (BTC) support levels may potentially "fail" before this week's close, representing a significant setback for those holding bullish positions.
Key points:
- The downside from recent peaks at $76,000 has brought BTC price losses close to the 10% mark.
- The 200-week trend line for Bitcoin is once again under scrutiny, though optimism about its ability to provide meaningful support appears limited.
- One market analyst cautions that sideways movement at these price levels could persist for "months."
The 200-week BTC price trend line proves "unreliable"
Through his most recent post on X this Thursday, cryptocurrency analyst and trader Rekt Capital highlighted a significant long-term trend line for BTC pricing.
The 200-week exponential moving average (EMA) for the BTC/USD pair, presently positioned around $68,300, is facing its first retest in more than seven days.
"Bitcoin is pulling back in towards the 200-week EMA (black) to check if it can successfully turn the EMA into new support after having broken it as resistance last week," he summarized.
This 200-week EMA has consistently remained a focal point for market traders. Together with its simple moving average (SMA) counterpart near $59,000, it creates a crucial support zone for pricing as the current bear market for Bitcoin continues to develop.
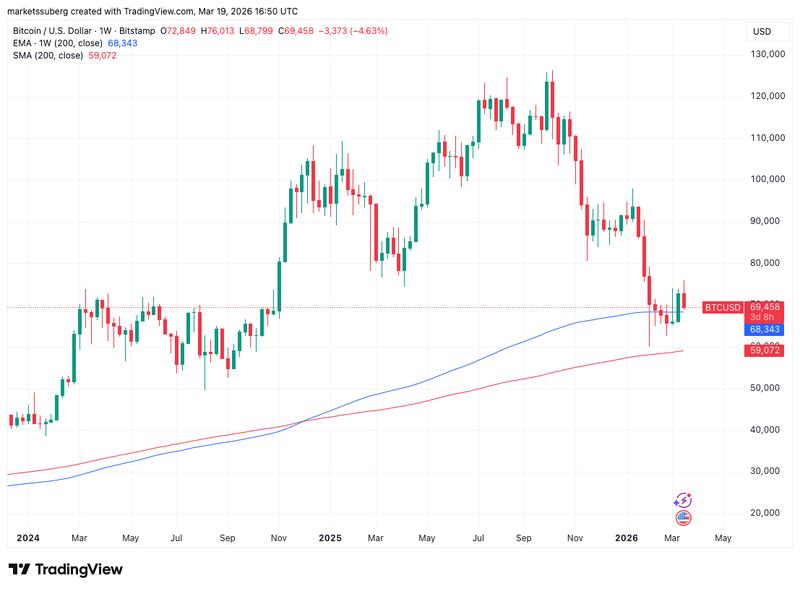
The BTC/USD trading pair has crossed above and below the 200-week EMA on numerous occasions throughout 2026, yet its importance as a metric continues to be relevant.
"A successful retest of the EMA would fully confirm the breakout beyond it to enable future trend continuation to the upside and further build on this Macro Relief Rally," Rekt Capital continued.
"However, it is important to consider whether Bitcoin could fail this upcoming retest into new support, in the same way price failed to bearish retest the 200 EMA into new resistance before."
The analysis characterizes the EMA as "unreliable" due to how easily price action has crossed both directions through this level.
"A Weekly Close below the 200 EMA would mean that price failed its upcoming retest to in turn strengthen the case for the EMA acting as unreliable support," Rekt Capital concluded.
Market analyst warns Bitcoin could trade sideways for "months"
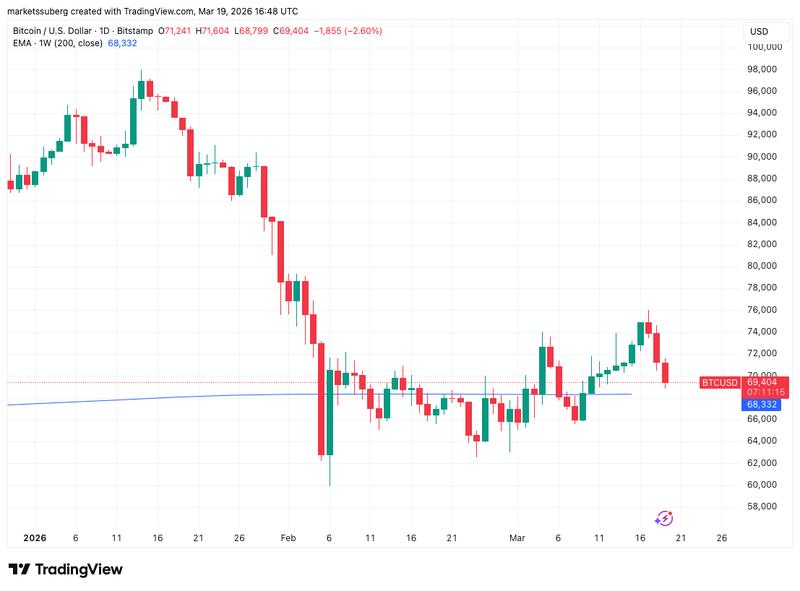
The present lower-time frame trading range for BTC contains several critically important technical levels.
The previous all-time high established by Bitcoin during 2021 sits at $69,500, while the 2025 lows presently establish the beginning of overhead resistance around $74,500.
To this point, those in bullish positions have failed to overcome selling pressure and push beyond $76,000, with numerous market observers anticipating fresh macro lows will emerge as prices have pulled back approximately 10%.
Sharing his perspective with X followers, trader Roman, who has maintained expectations for a potential move toward $50,000 or even lower, indicated that sideways price action may materialize before any major moves.
"It's very possible we range here for months," he warned.