BTC Falls 3% While Experts Caution Bulls Insufficient 'Strength' to Break Past $69K
BTC has retreated to a price zone where it previously consolidated for several months two years prior, with technical analysis suggesting potential historical patterns may emerge again.

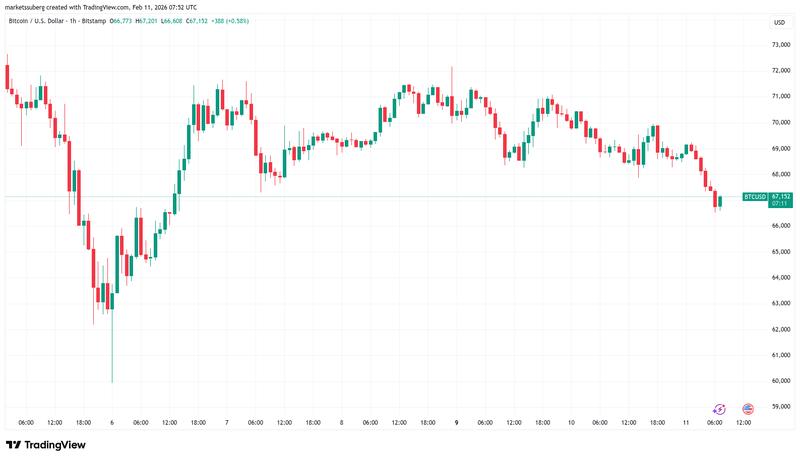
Bitcoin (BTC) reached fresh lows for the week on Wednesday with the $66,500 level emerging as the next area of interest.
Key points:
- Bitcoin is trading in a key historical zone, but buyer pressure is too weak to break resistance.
- Analysis sees current range resistance potentially lingering months as a result.
- February BTC price downside has almost beaten 2025.
Analysis: Bitcoin bulls too weak to crack $69,000
Information from TradingView showed BTC price declining by close to 3% on a daily basis following another instance where the $70,000 zone demonstrated insufficient support.
With projections of potential bottoms at $50,000 or even lower levels still circulating, BTC/USD provided market participants with limited incentive to adopt a bullish stance.
Keith Alan, cofounder of trading resource Material Indicators, highlighted the critical nature of the present confined trading zone.
"$BTC continues to show signs of weakness around $69k, however if you look back to 2024 you will notice that price spent an extraordinary amount of time consolidating in this range," he wrote in one of his latest posts on X.
"That 8 months of consolidation, coupled with the 2021 Top created structural strength at this level, and it's good to see the market acknowledging that."
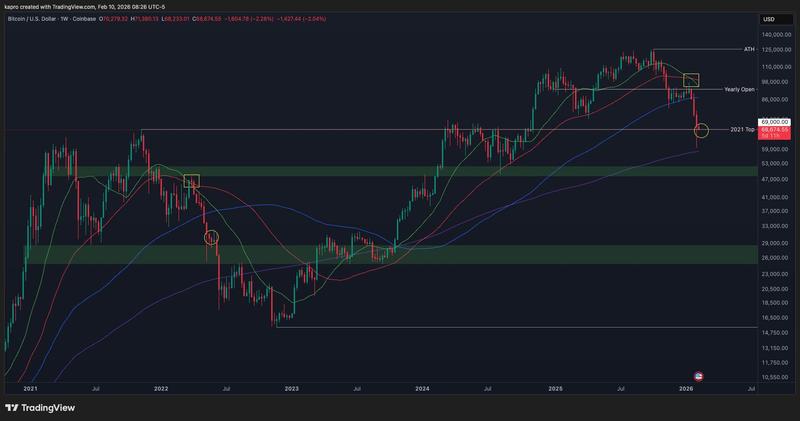
The importance of the $69,000 threshold, nonetheless, indicates it might serve as both a support and resistance level going forward.
"If a bullish catalyst emerges and triggers a recovery, we can conclude that the additional consolidation in this range, fortified structural support," Alan continued.
"Likewise, if the downtrend extends from here as history (and the charts) suggests, resistance at this range will be even stronger than it was in 2024. That doesn't mean it will be impenetrable, it just means that it's going to take a lot of momentum to break it. At this moment in time, we aren't seeing enough momentum to do that in a sustainable way."
BTC price eyes biggest February loss since 2014
Looking at more compressed time frames, a localized bottom may have already formed, according to data from pseudonymous trader Killa.
Recent data shared on X demonstrate that BTC price action frequently establishes its monthly peak or trough somewhere between the fourth and seventh day of any particular monthly candle.
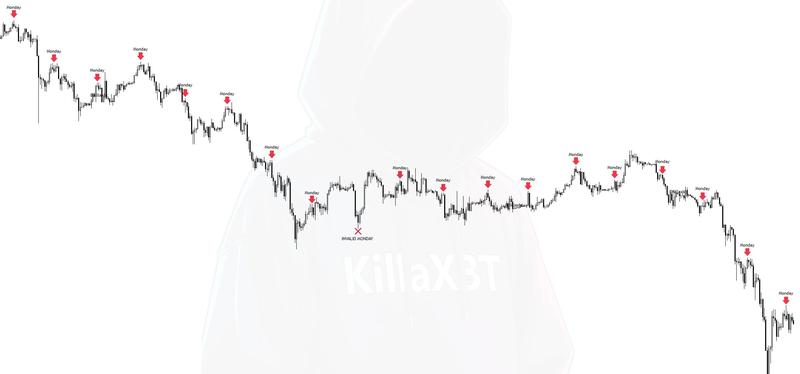
Mondays, on the other hand, have proven especially favorable for traders holding short positions ever since Bitcoin started declining from all-time highs in October 2025.
"You could have shorted $BTC every Monday for the past 4 months & won 18/19 trades," Killa told followers.
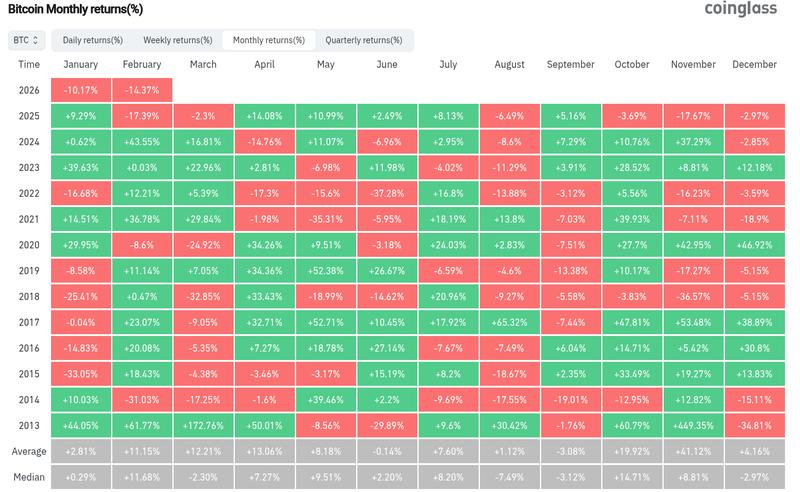
Information from monitoring resource CoinGlass indicates that with a decline of -14.4%, Bitcoin's February losses in 2026 are nearly matching the previous year's performance. However, since 2013, February has only ended in the red three times.